This topic contains a solution. Click here to go to the answer
|
|
|

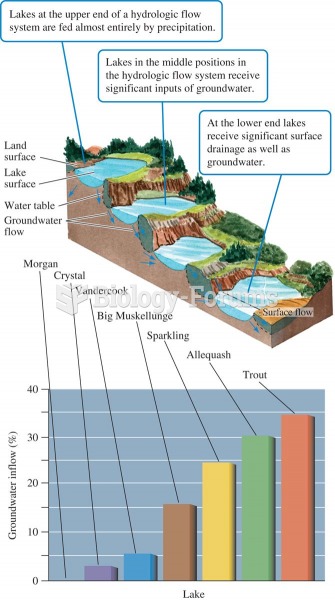 Lake position in the landscape and proportion of water received as groundwater (data from Webster et
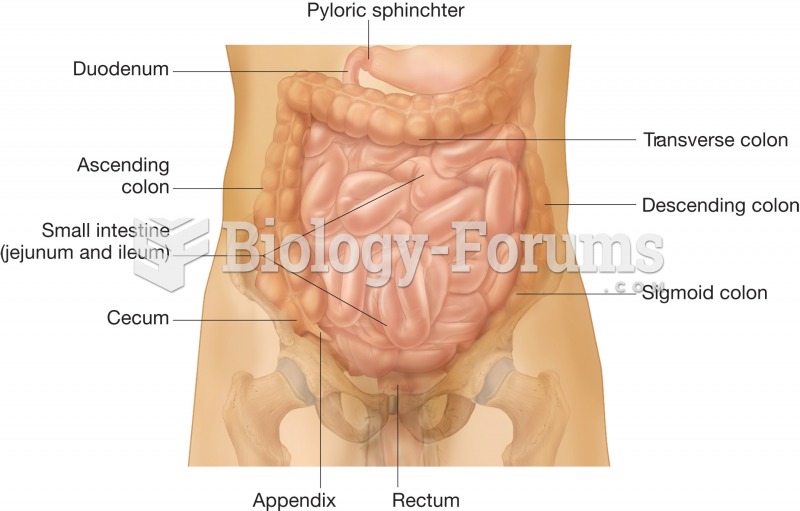 The small intestine. Anterior view of the abdominopelvic cavity illustrating how the three sections
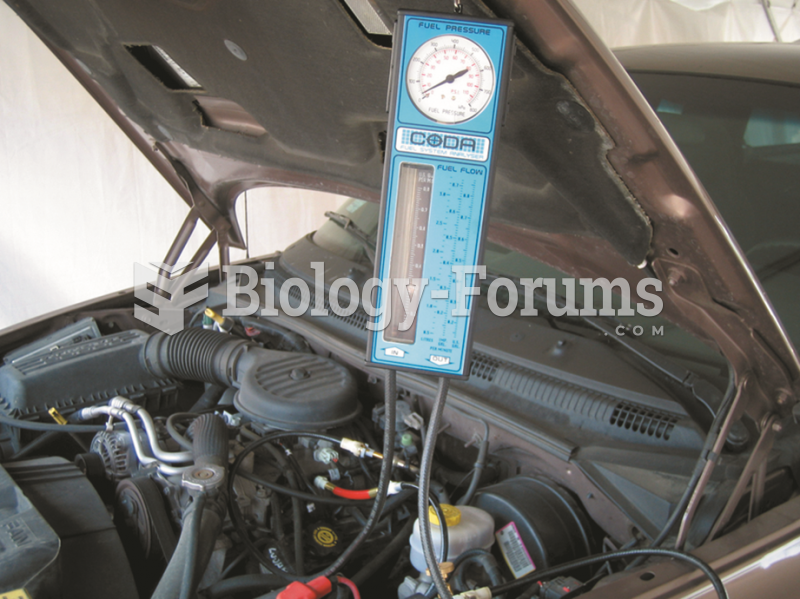 A fuel system tester connected in series in the fuel system so all of the fuel used flows through ...
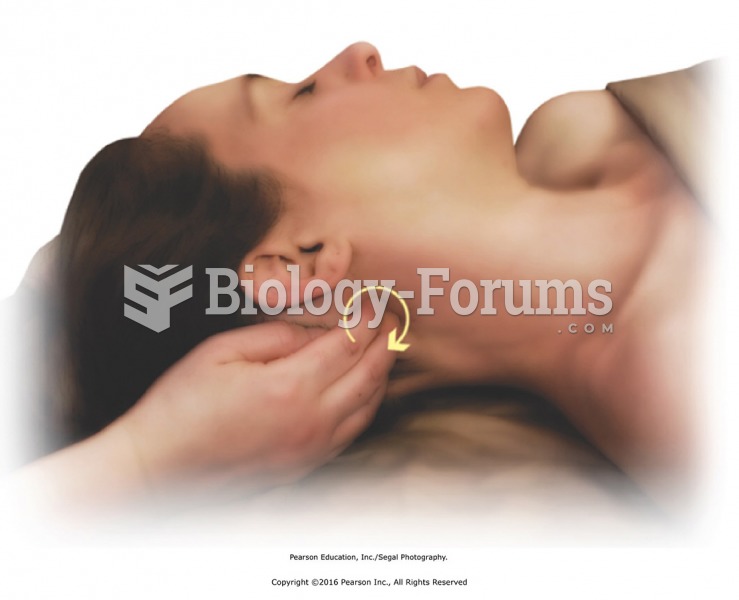 Apply circular friction and direct pressure to suboccipital muscles one side at a time.Turn head to ...
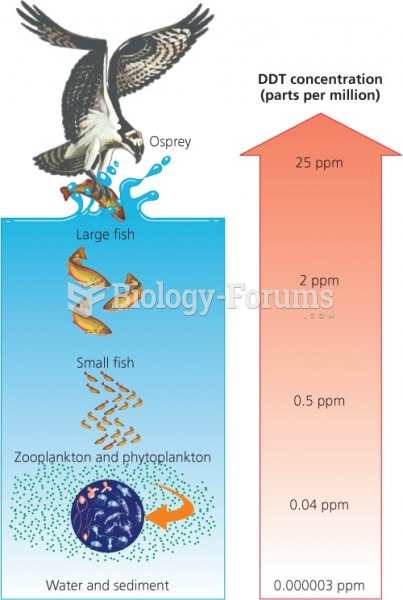 Accumulation of toxicants over time and up the food chain
 Time-of-entry mapping