|
|
|

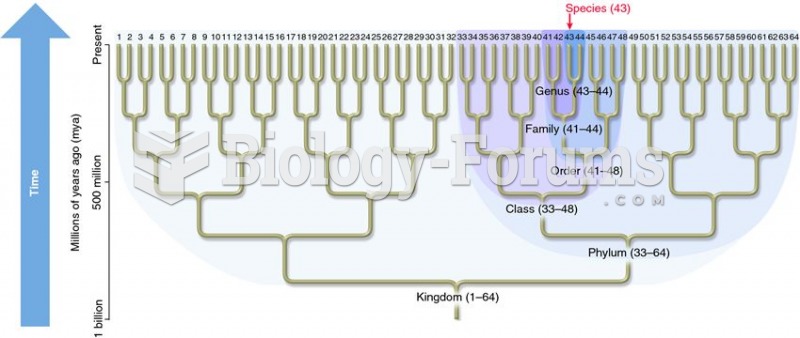 Schematic relationship between a phylogenetic tree and taxonomy.
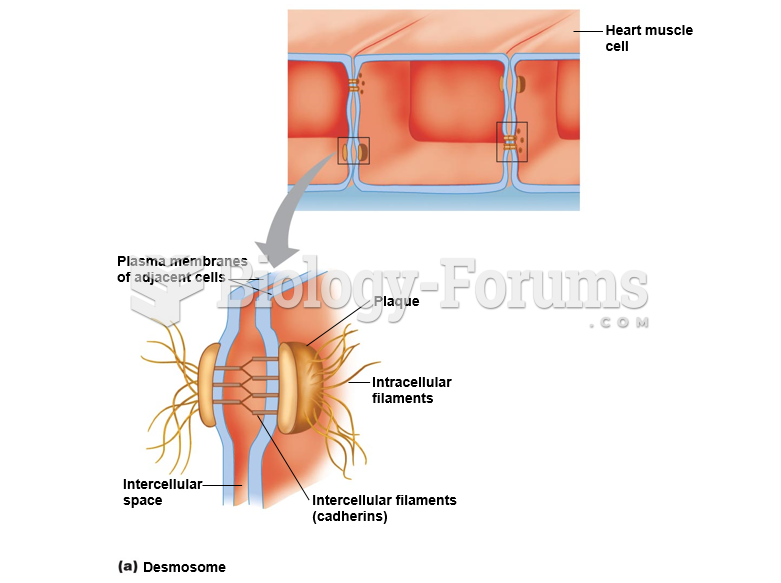 Desmosomes and gap junctions, as shown in heart muscle: Desmosome
 Wearing a pedometer, like the one shown here, can help you track your steps
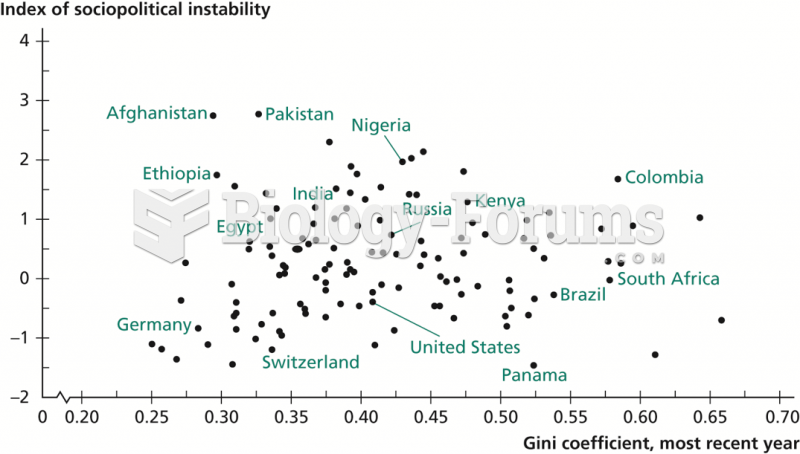 Relationship between Income Inequality and Sociopolitical Instability
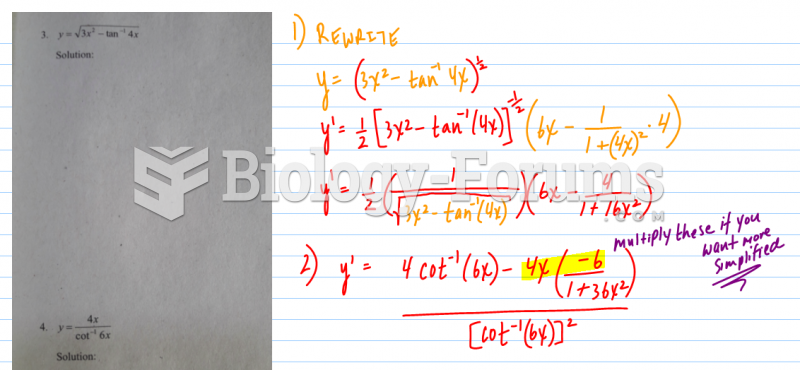 Derivative of Inverse Trig Function
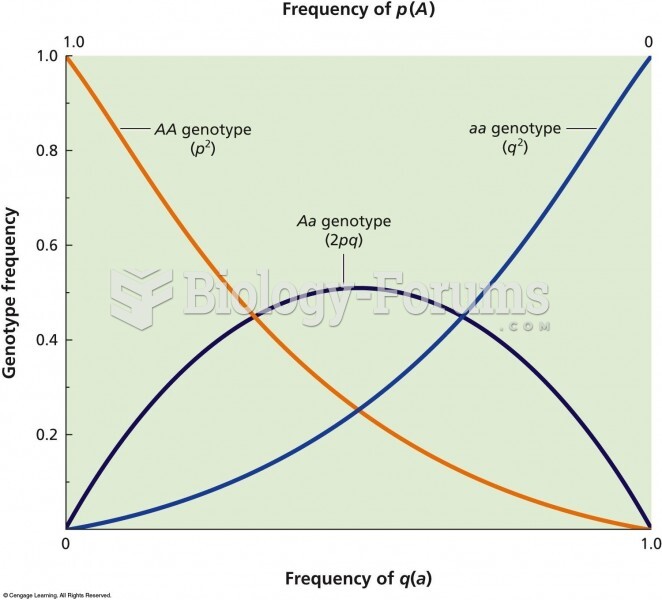 The relationship between allelic frequency and genotypic frequency in a population that is in Hardy-