|
|
|

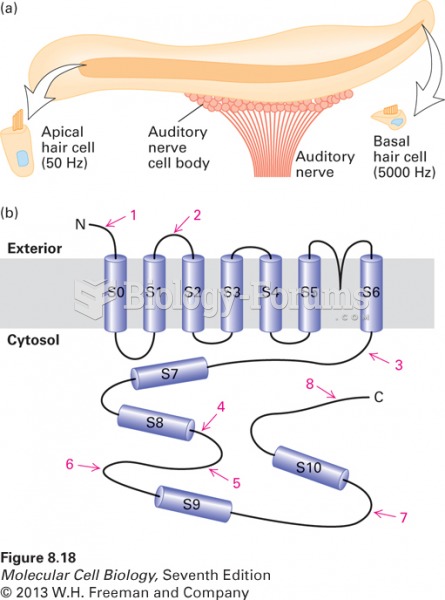 Role of alternative splicing in the perception of sounds of different frequency
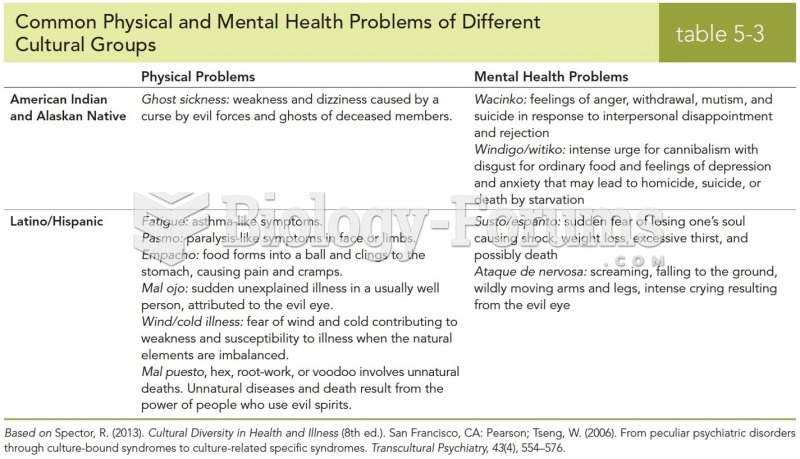 Common Physical and Mental Health Problems of Different Cultural Groups
 After verifying that the tester is capable of correctly reading the air frequency, gasoline is ...
 Groups of Elephants
 The effect of selection on allele frequency
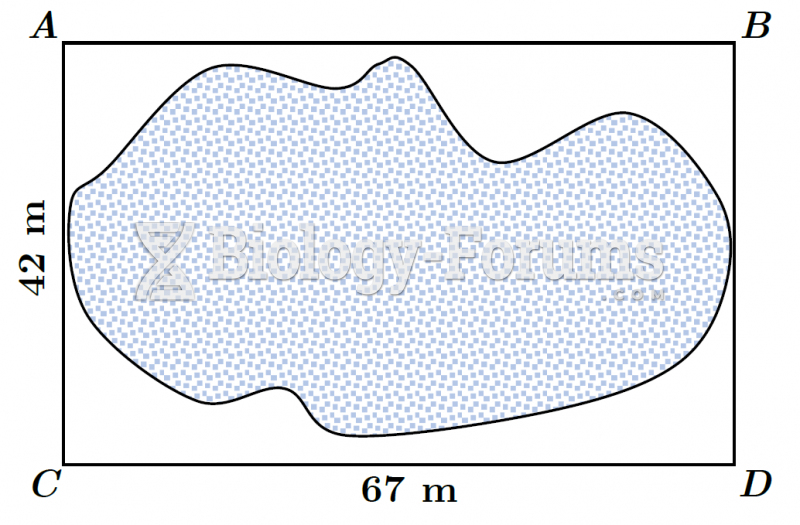 Plot of Land (Modified Offset Method) - Boxed