|
|
|

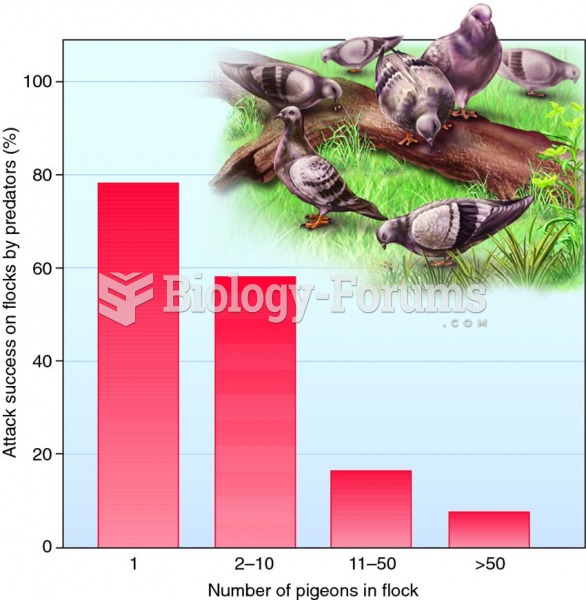 Living in groups and the many eyes hypothesis.
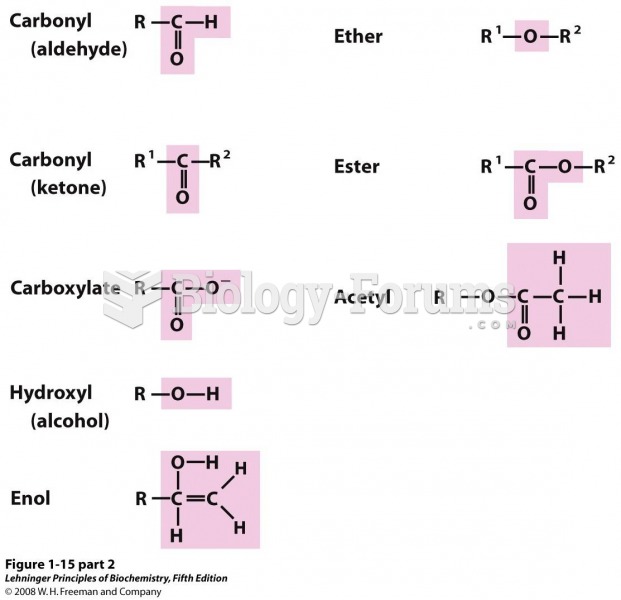 functional groups of biomolecules
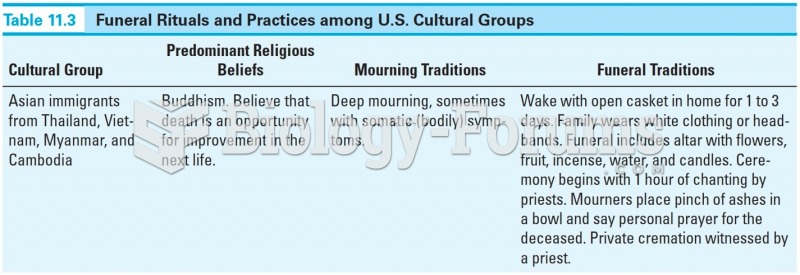 Funeral Rituals and Practices among U.S. Cultural Groups
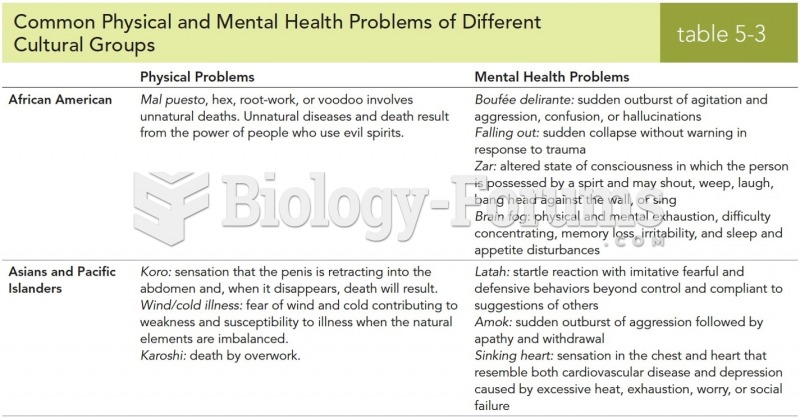 Common Physical and Mental Health Problems of Different Cultural Groups
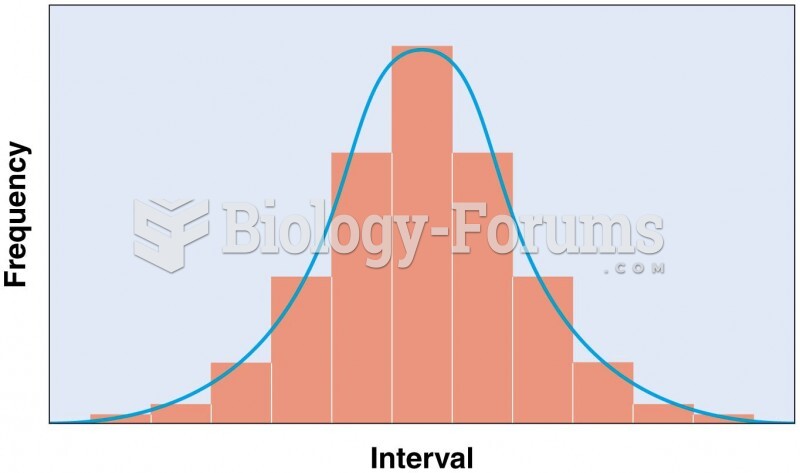 Normal frequency distribution, characterized by a bell-shaped curve
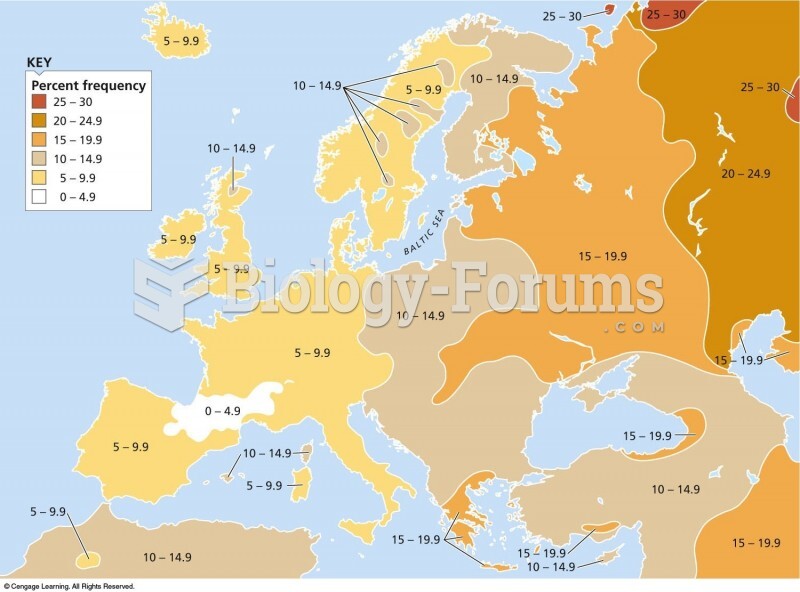 The gradient of the B allele of the ABO blood groups from East to West is due to waves of migration