|
|
|

 The Acheulean industry is typified by hand axes and cleavers.
 Table 6.1 illustrates the main regime types and their differences. It breaks the regimes into four
 Common Physical and Mental Health Problems of Different Cultural Groups
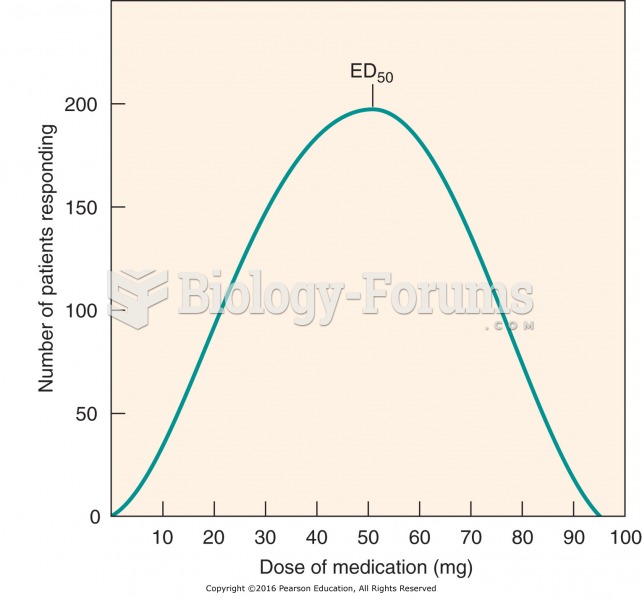 Frequency distribution curve: interpatient variability in drug response.
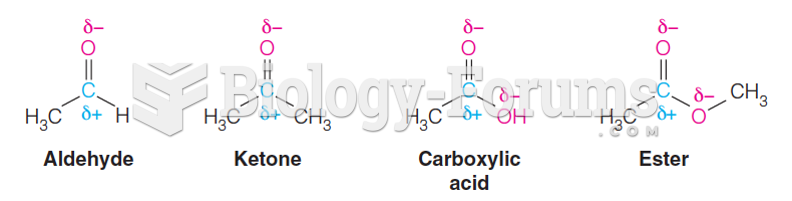 Carbonyl groups reaction type
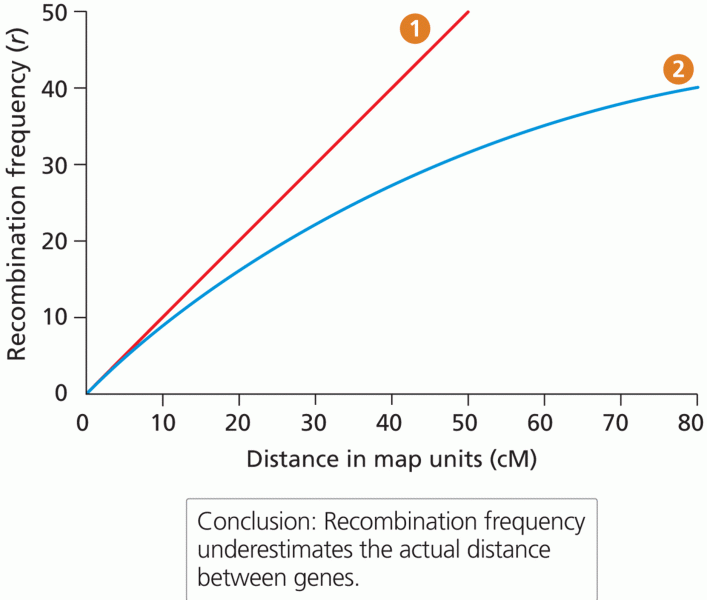 The relationship between recombination frequency and physical distance between genes