|
|
|

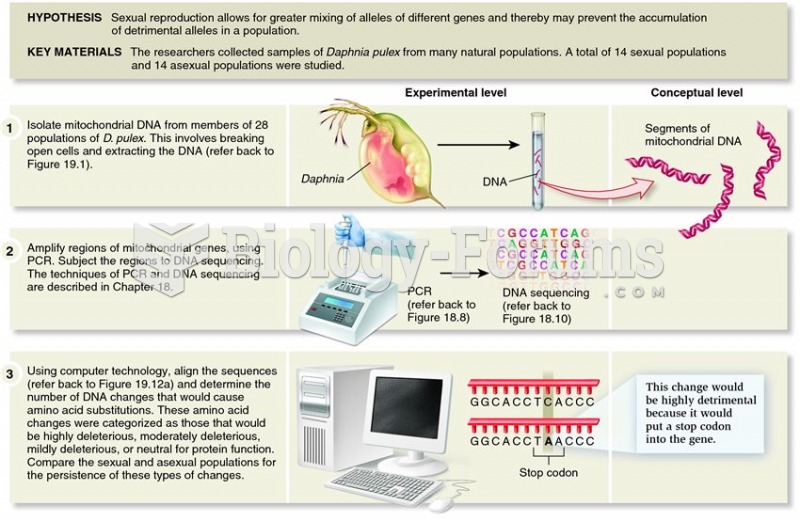 Paland and Lynch demonstrated the importance of sexual reproduction in reducing the frequency of mal
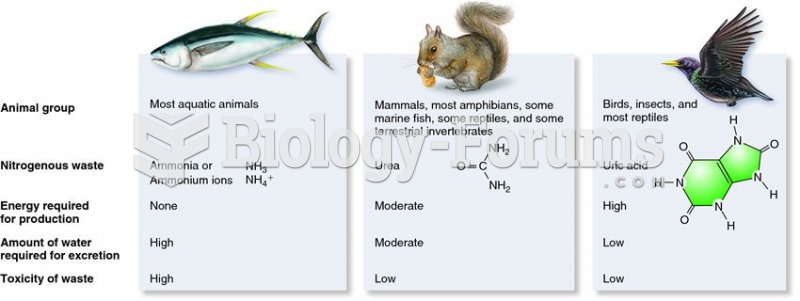 Nitrogenous wastes produced by different animal groups.
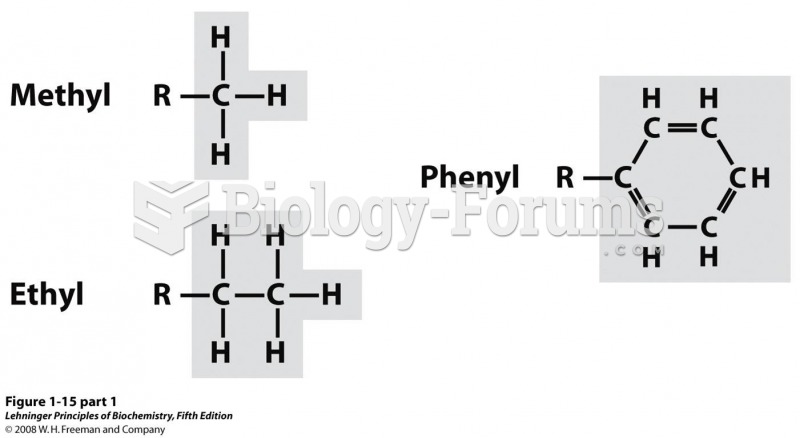 Some common functional groups of biomolecules
 (a) Savanna baboons live in female-philopatric groups, among which males migrate. (b) Chimpanzees li
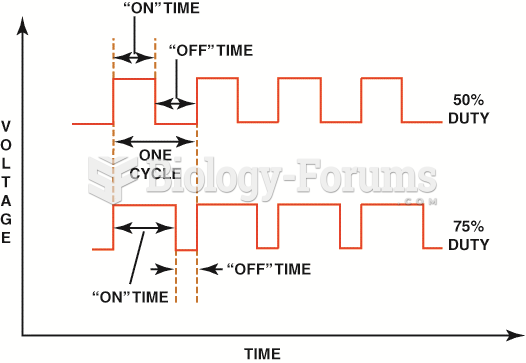 Both the top and bottom pattern have the same frequency. However, the amount of on-time varies.
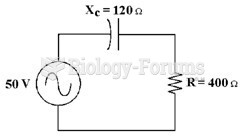 If the frequency equals 60 Hz in Figure 10-1, what is the value of capacitance?