|
|
|

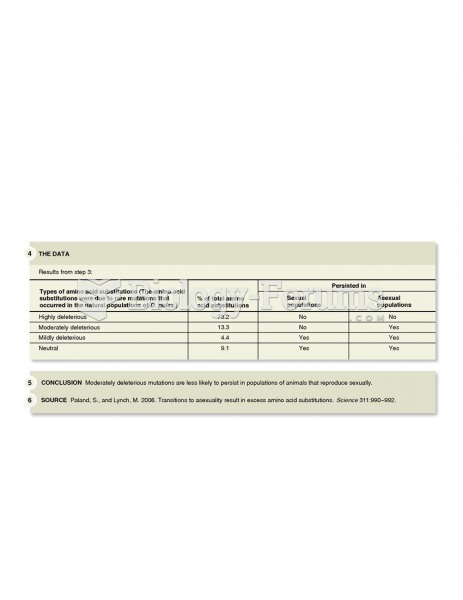 Paland and Lynch demonstrated the importance of sexual reproduction in reducing the frequency of mal
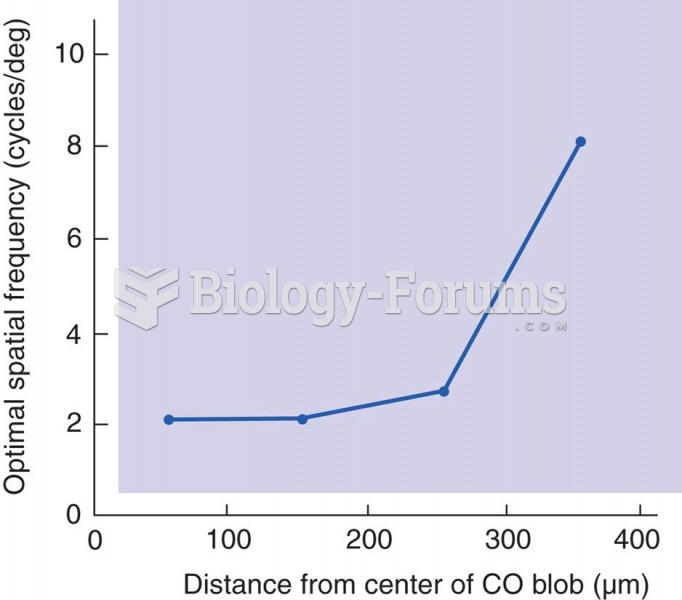 Organization of Spatial Frequency
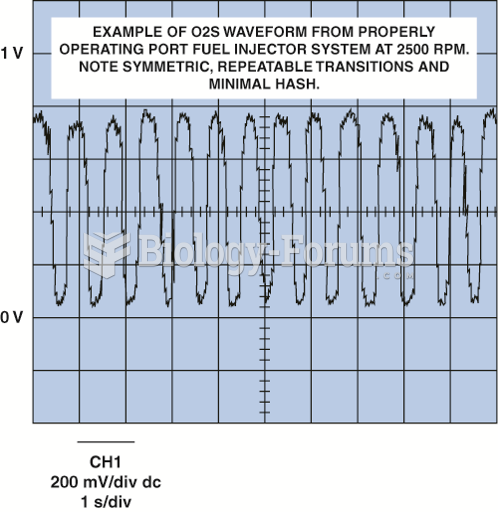 Normal oxygen sensor frequency is from about one to five times per second.
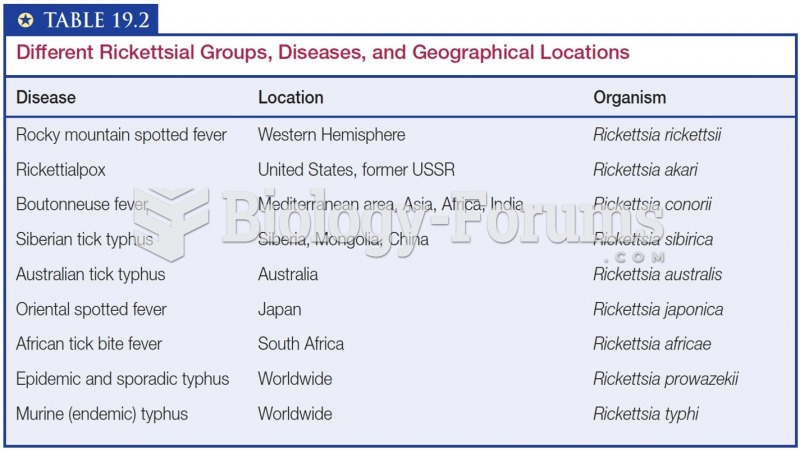 Different Rickettsial Groups, Diseases, and Geographical Locations
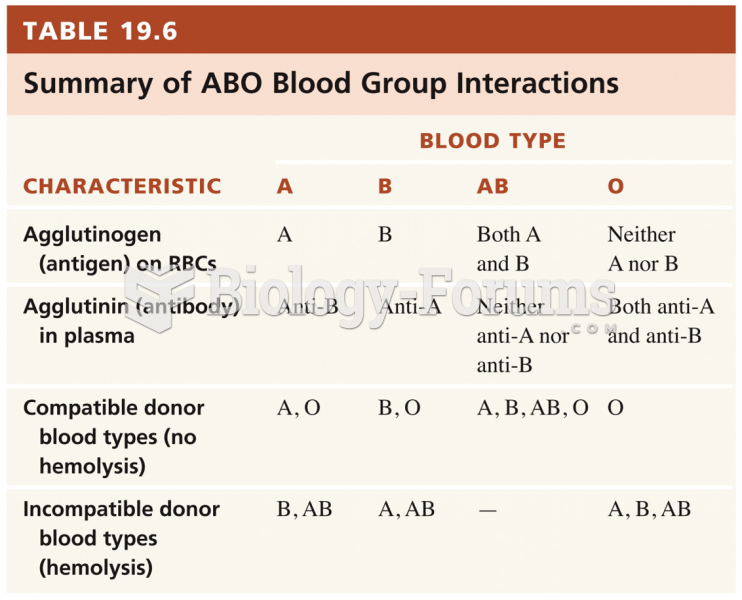 Blood Groups and Blood Types
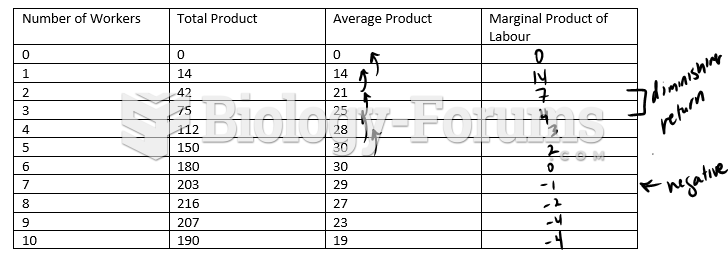 Complete the following production chart and plot the points.