|
|
|

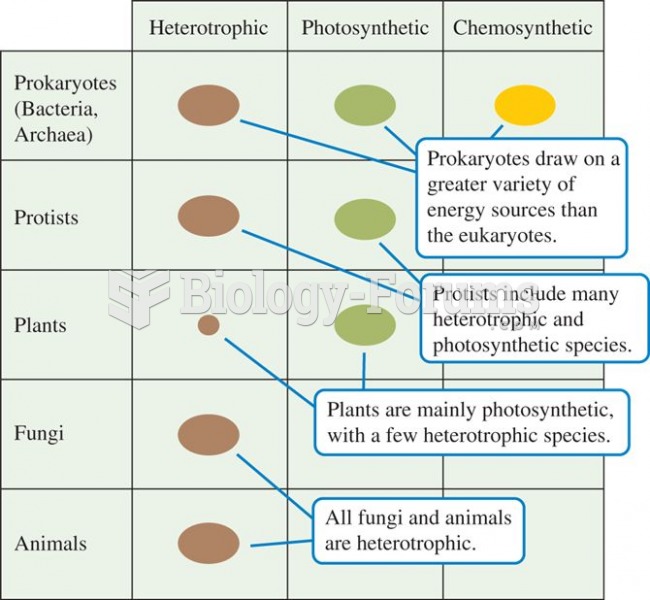 A plot of trophic diversity across the major groups of organisms shows highest trophic diversity amo
 Many thought ideological politics was over in the United States, but 2012 showed strong ideological
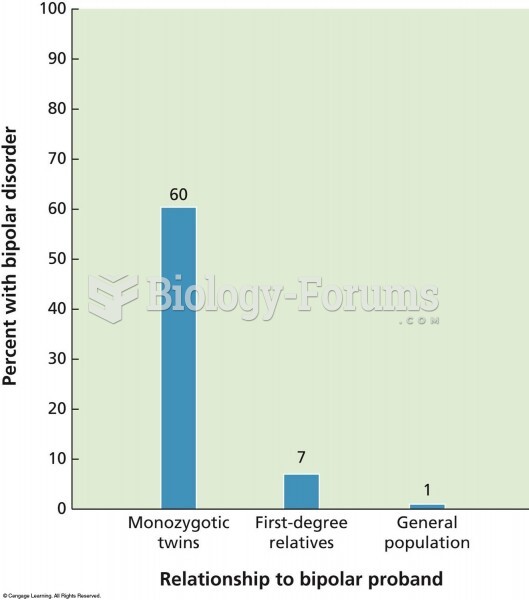 The frequency of bipolar illness in members of monozygotic twin pairs and in first-degree relatives
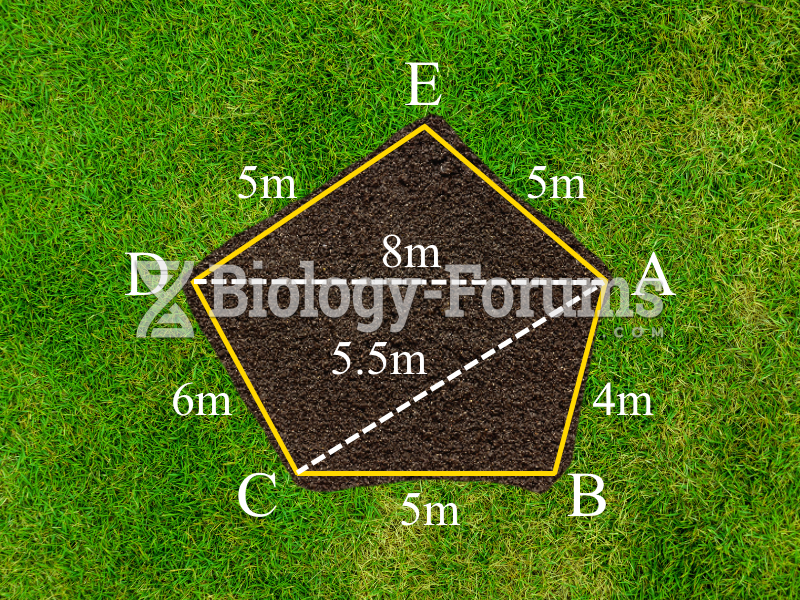 Plot of land (Part c)
 The three embryonic axes of a zebrafish
 The frequency distribution of the allele in Southeast Asia and the Pacific Islands