|
|
|

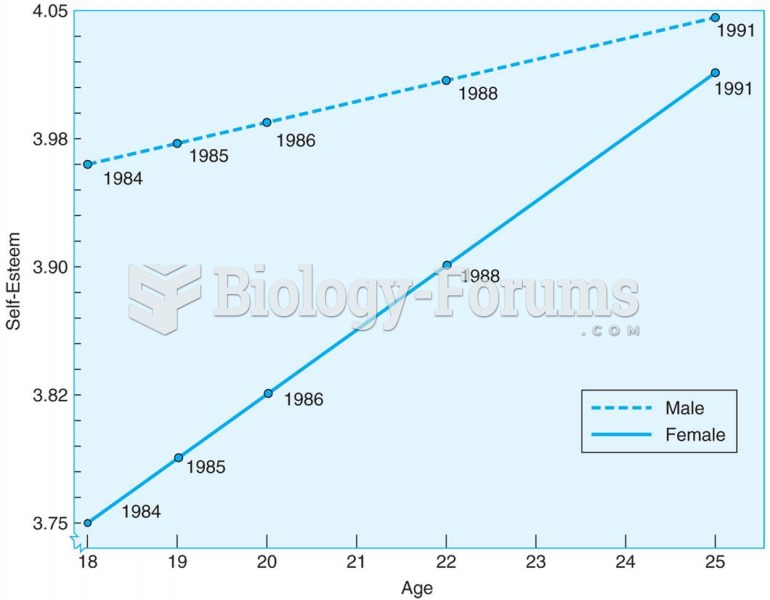 Young adults increase in self-esteem between the ages of 18 and 25, according to this longitudinal s
 Material safety data sheets (MSDS), now called safety data sheets (SDS), should be readily available ...
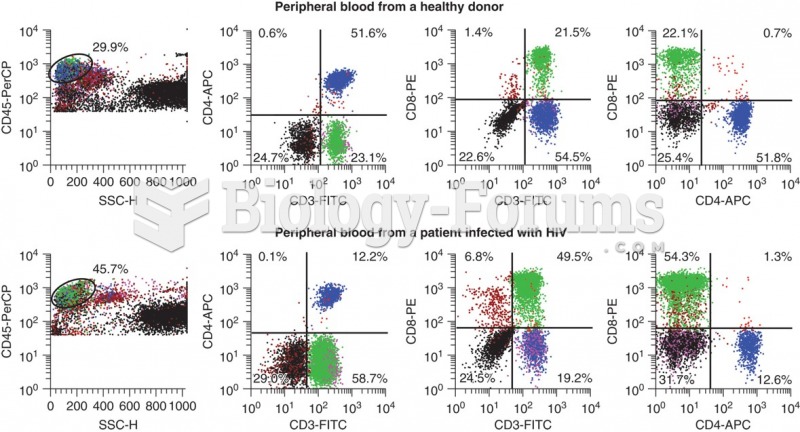 Flow cytometry data that shows the differences in CD3+ CD4+ cells that occur with HIV infection. ...
 How to analyze trends found in graphs
 Business Intelligence, Analytics, and Data Science: A Managerial Perspective, 4th Edition
 The expected value for a binomial probability distribution is _____.