This topic contains a solution. Click here to go to the answer
|
|
|

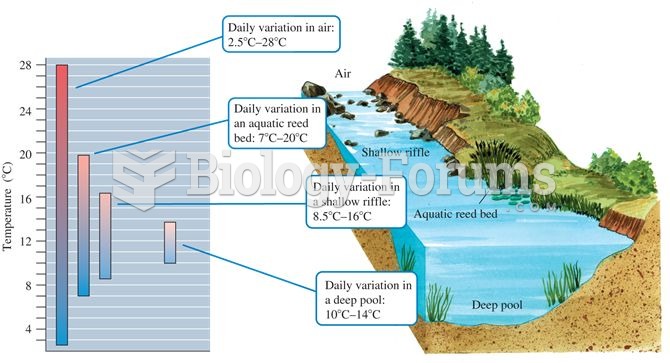 Aquatic microclimates: aquatic environments generally show less temperature variation compared to te
 A lilac, orange and white Satin Peruvian guinea pig (show-length coat)
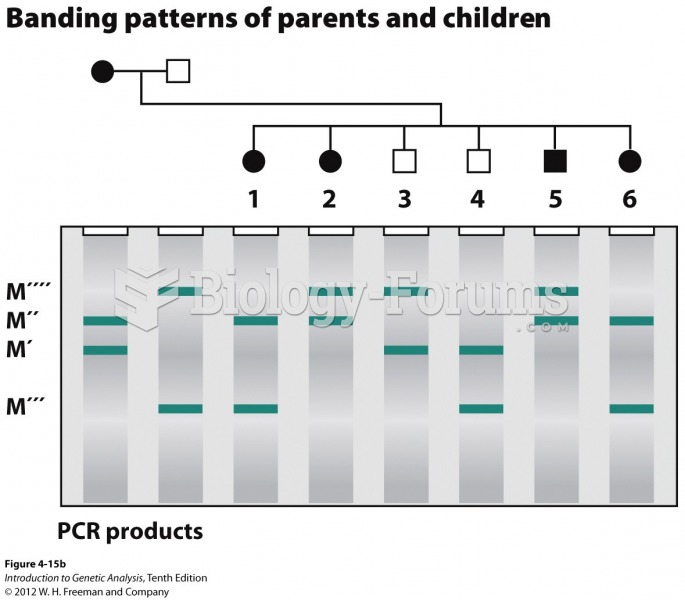 A microsatellite locus can show linkage to a disease gene
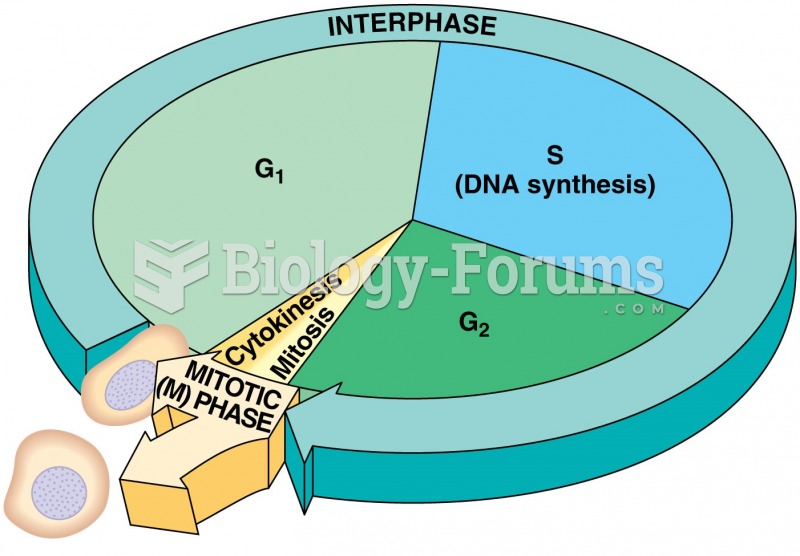 Mitosis + Check Points 1 of 5
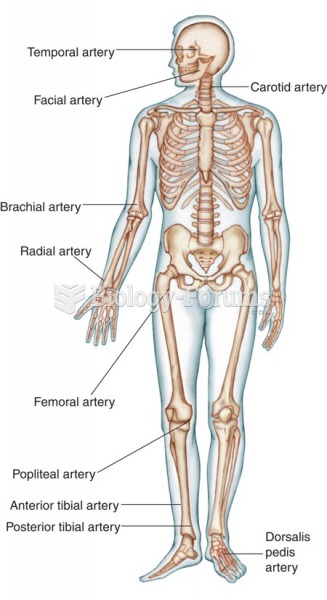 The primary pulse points of the body.
 Age and Trends in Poverty