|
|
|

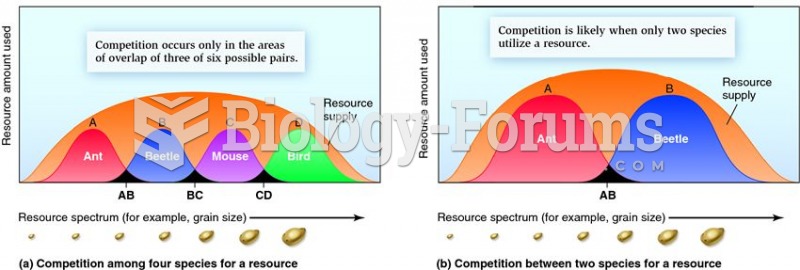 The frequency of competition according to the number of species involved.
 The cranium of a young infant changes dramatically in shape with age. Initially the child has severa
 Distribution of the Income of Americans
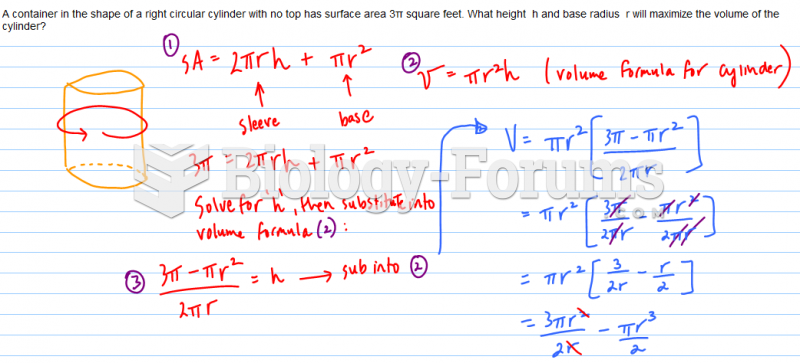 A container in the shape of a right circular cylinder with no top has surface area square feet.
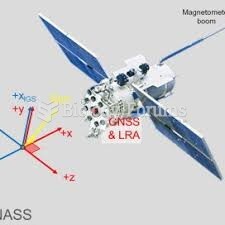 Spacecraft optimum geometrical shape
 The effect of selection on allele frequency