|
|
|

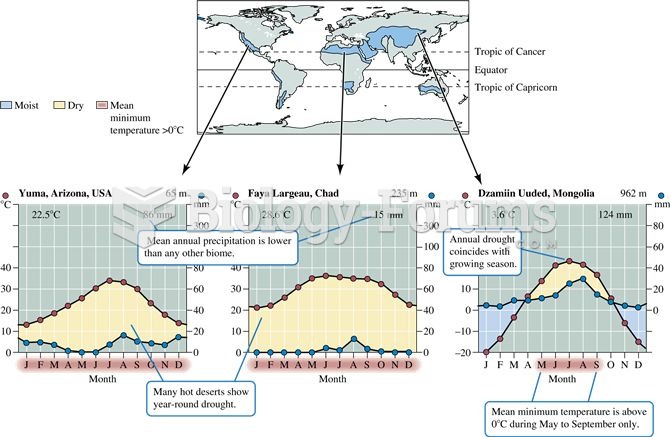 Desert distribution and climate
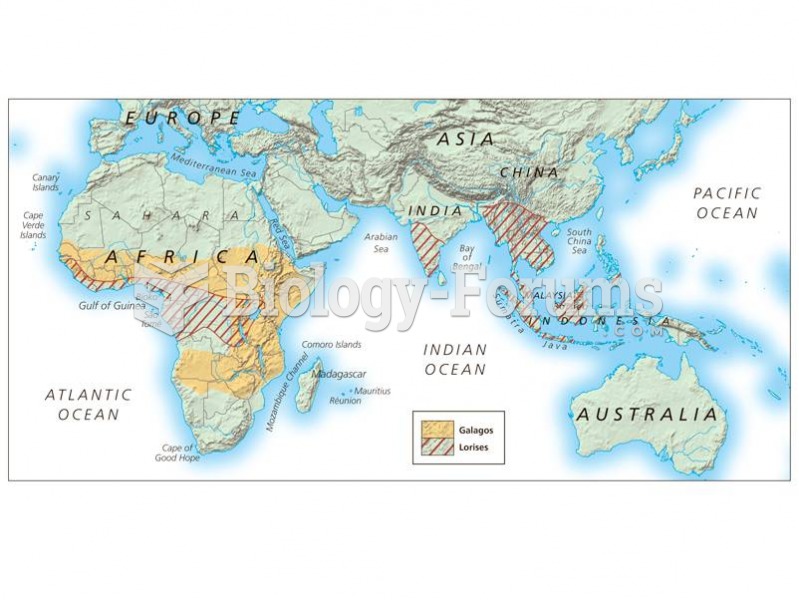 The distribution of lorsies and galagos.
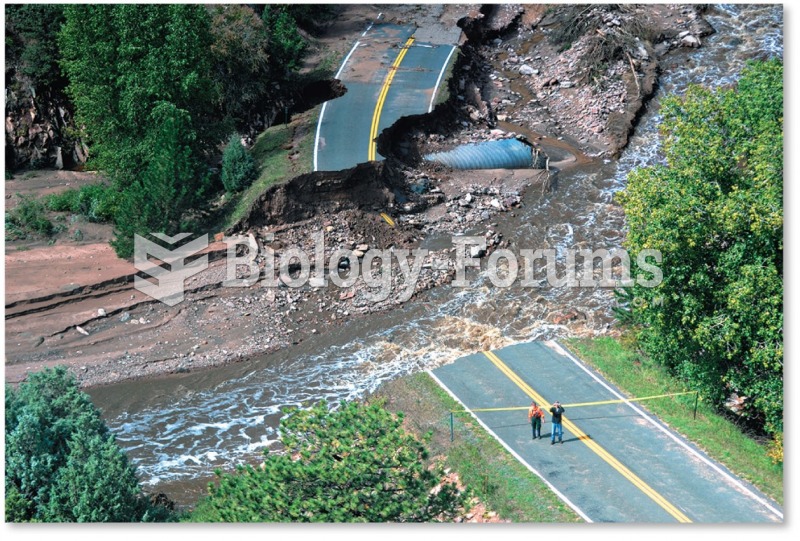 Distribution of Thunderstorms: Approximately 14.5 million thunderstorms occur each year across the ...
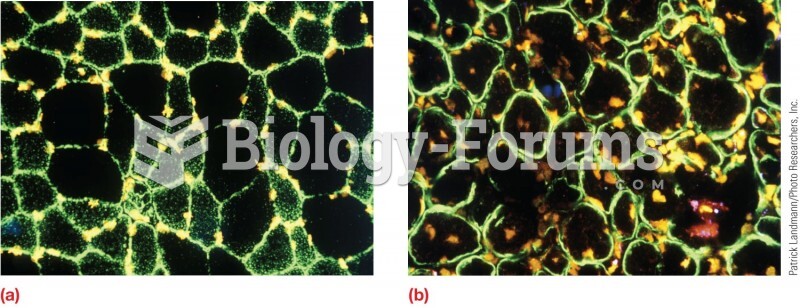 Distribution of dystrophin in muscle cells. (a) In normal muscle cells, all the dystrophin is locate
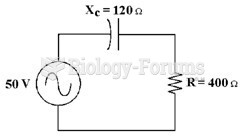 If the frequency equals 60 Hz in Figure 10-1, what is the value of capacitance?
 Distribution of fluid compartments in the body