|
|
|

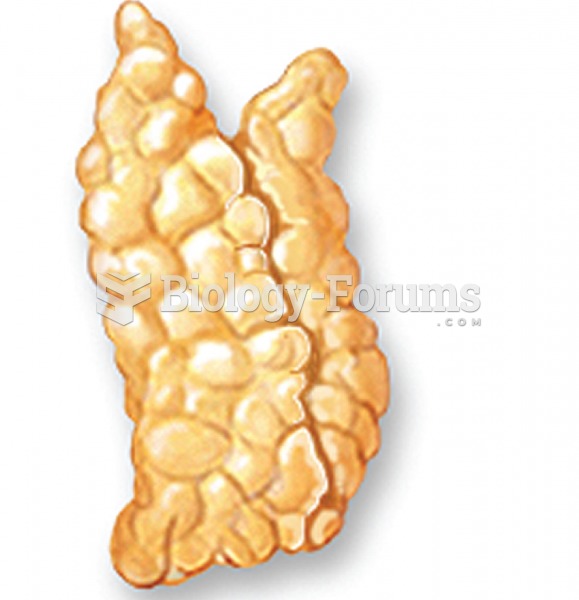 Shape of the thymus gland.
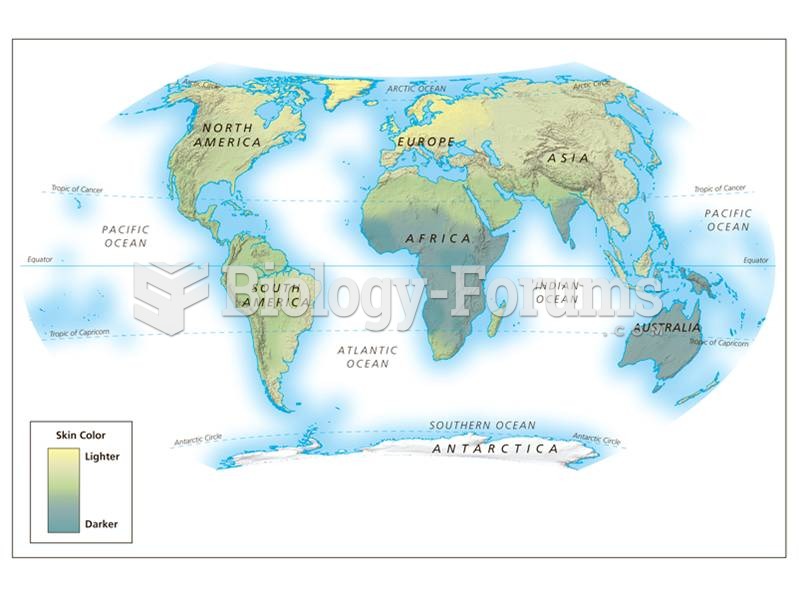 World map of the distribution of skin color.
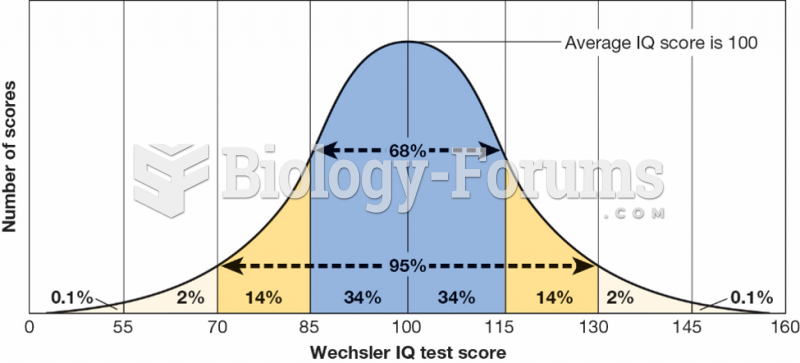 Normal Distribution of IQ Scores
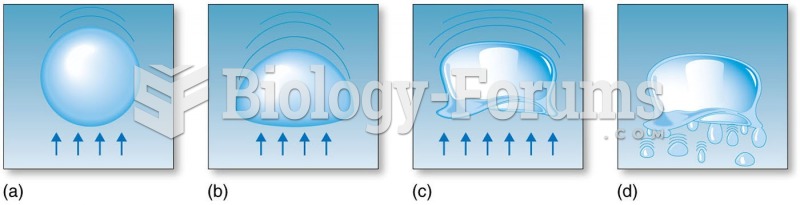
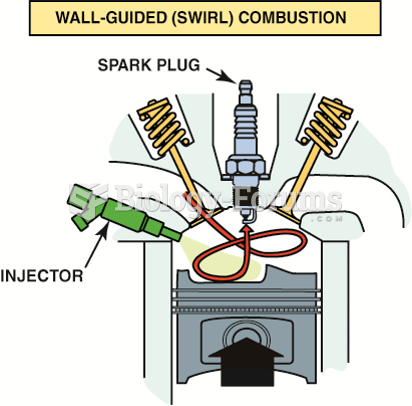 The side injector combines with the shape of the piston to create a swirl as the piston moves up ...
 Distribution and Forms of Precipitation: Rain
 The distribution of Neandertal and Denisovan DNA in the modern human genome