|
|
|

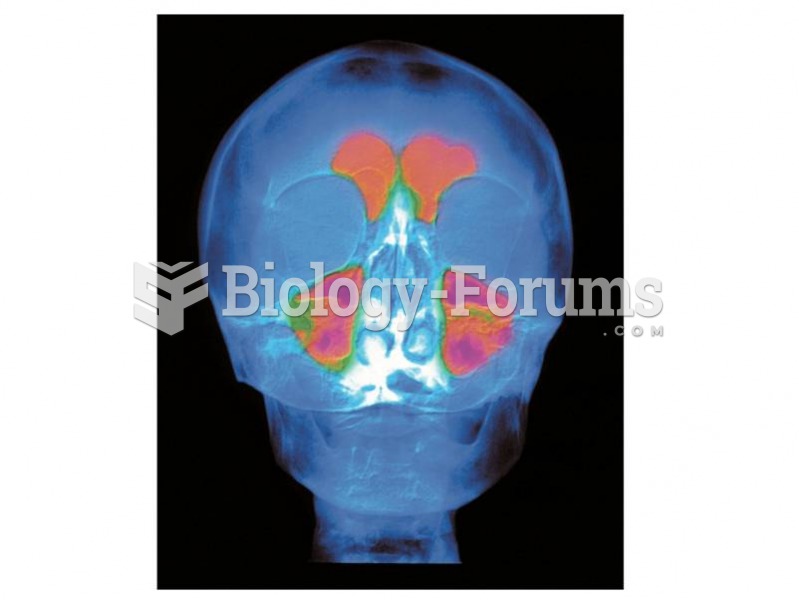 The frontal sinus, an airfilled space just behind the brow, is a unique size and shape in each of us
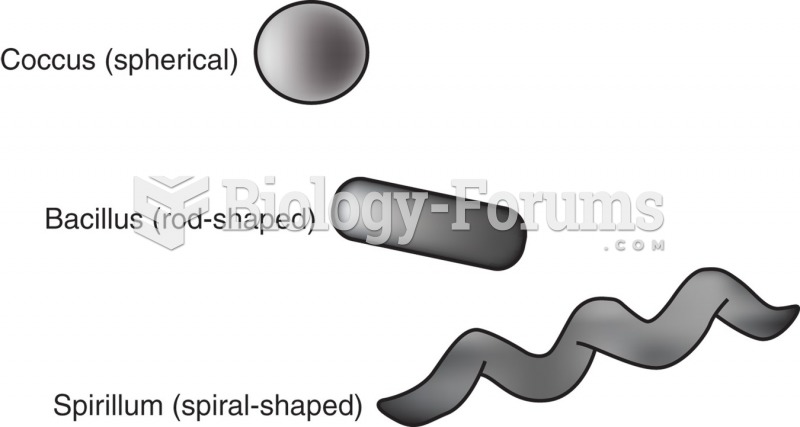 Bacteria may be named for their morphology (shape): cocci (spherical), bacilli (rod shaped), or ...
 Three factors that influence the distribution of Na+ and K+ ions across the neural membrane.
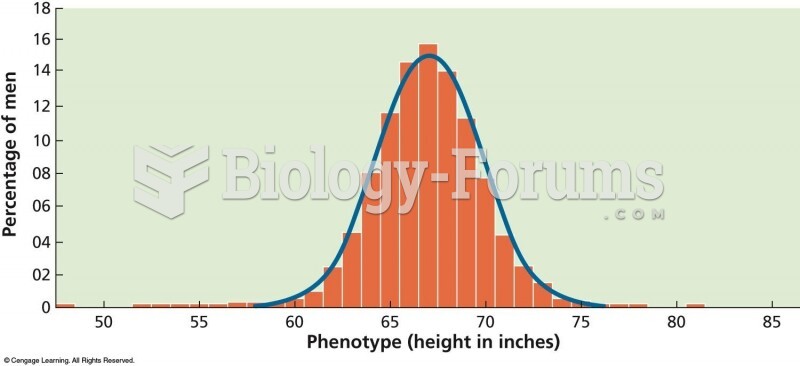 A bell-shaped, or “normal,” curve shows the distribution of phenotypes for traits controlled by ...
 The frequency distribution of the allele in Africa, Southern Europe, the Middle East
 The consequences of the intensity of natural selection on allele frequency.