|
|
|

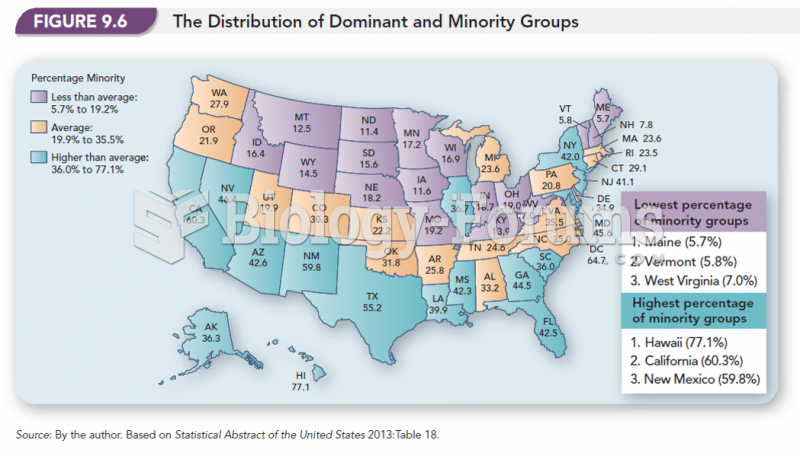 The Distribution of Dominant and Minority Groups
 The first step is to verify the proper operation of the tester by measuring the air frequency by ...
 The typical distribution of neurofibrillary tangles and amyloid plaques in the brains of patients ...
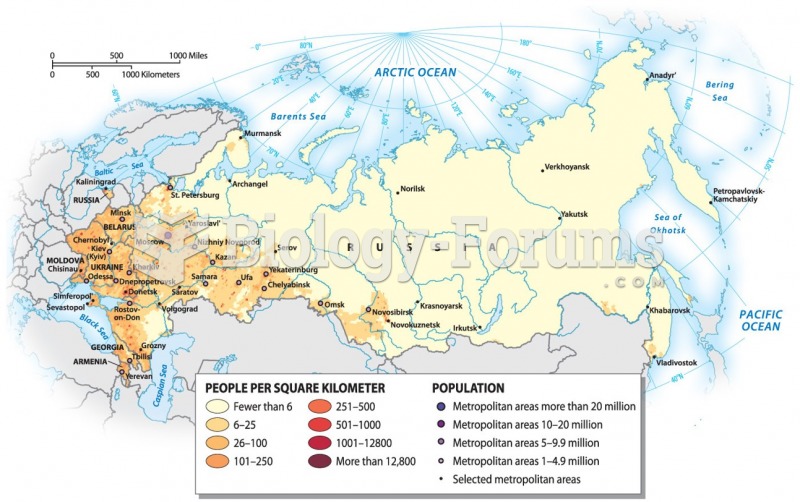 Population Distribution
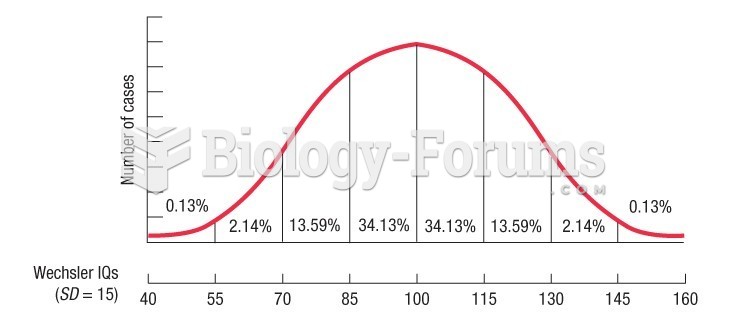 IQ scores form what mathematicians call a normal distribution "bell curve"
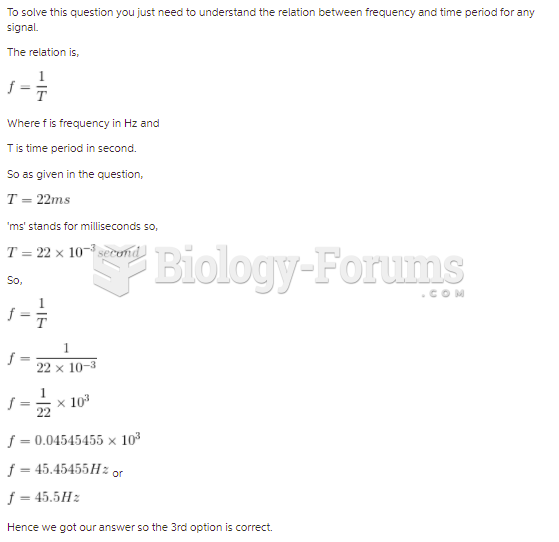 If the period of a square wave is 22 ms, what is its frequency?