|
|
|

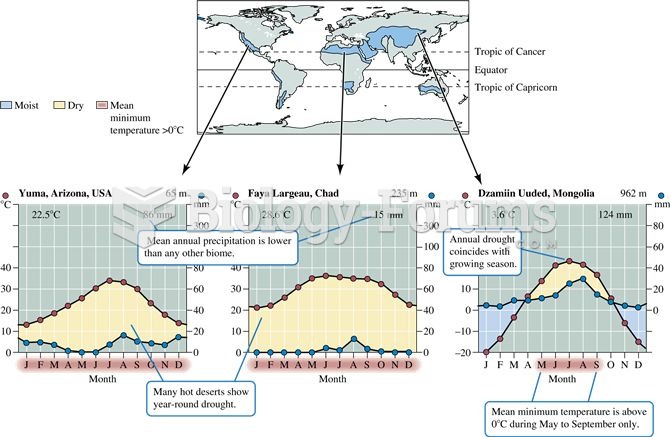 Desert distribution and climate
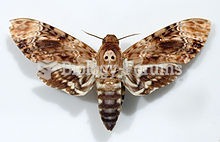 Death's-head Hawkmoth (Acherontia lachesis), an old bleached specimen still showing the classic
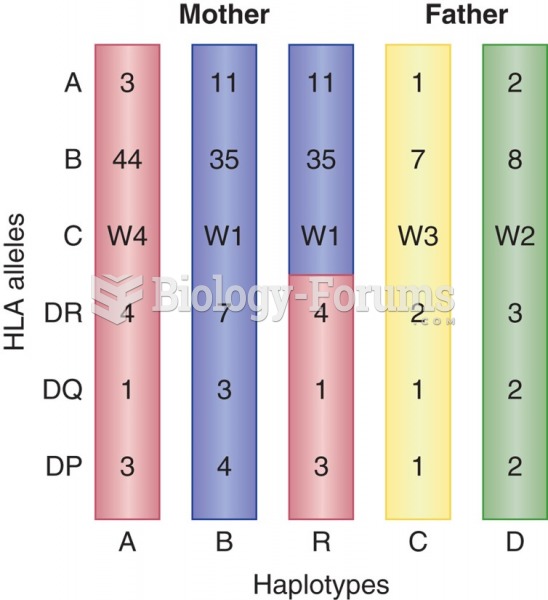 Sample composition of maternal and paternal HLA haplotypes.
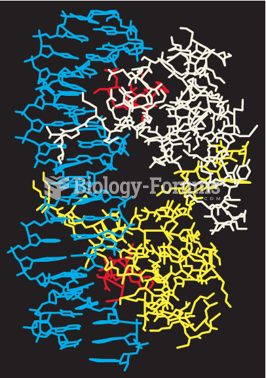 Structure of the l cI repressor-DNA complex showing the recognition helices (in red)
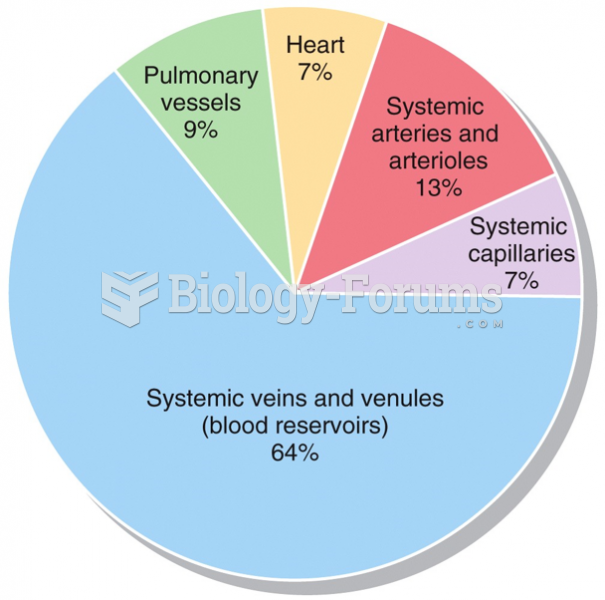 Blood Distribution
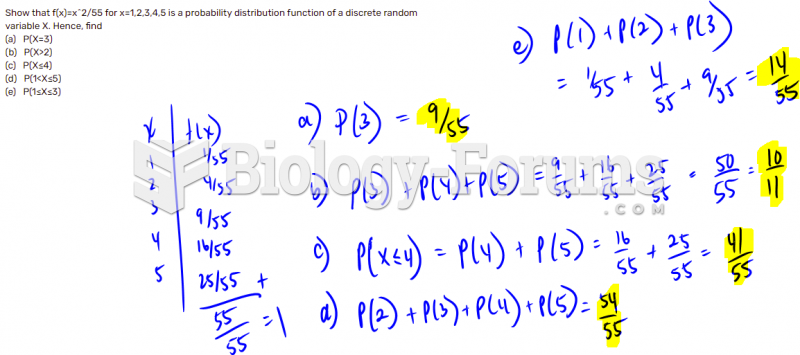 Discrete random variables- Probability Distribution Function