|
|
|

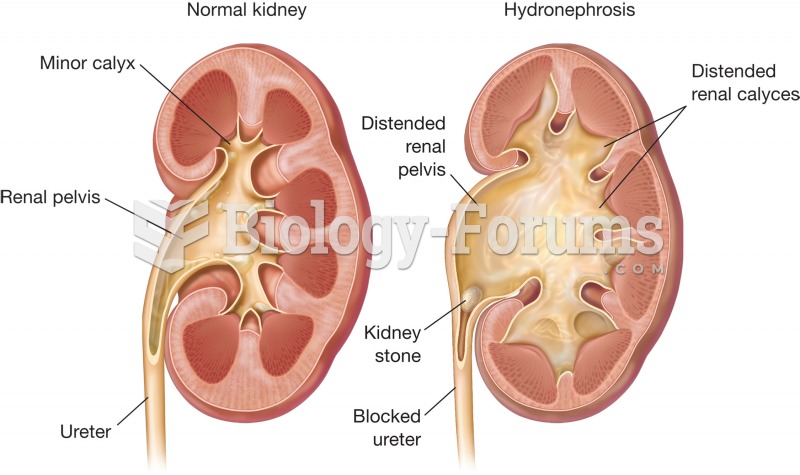 Hydronephrosis. Normal kidney (left) and kidney with hydronephrosis (right) are compared. Note the d
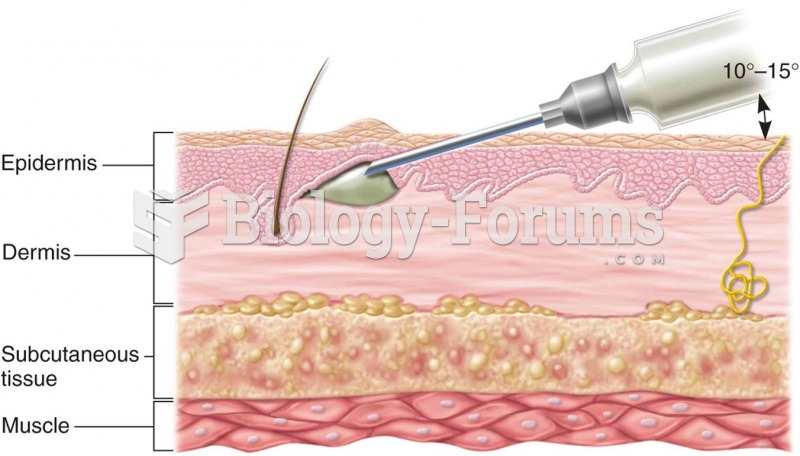 Intradermal drug administration: (a) cross section of skin showing depth of needle insertion Source:
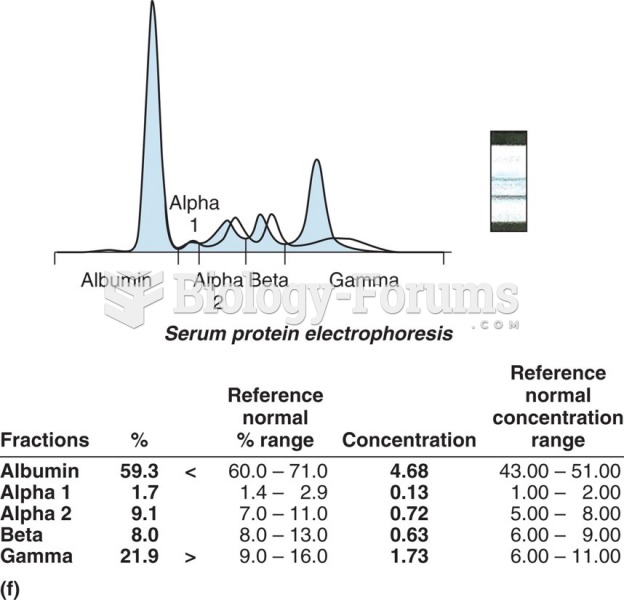 SPE densitometry showing an M spike in the gamma region.
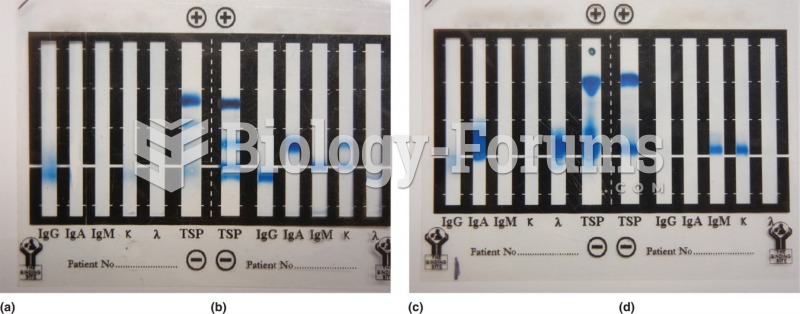 Immunofixation electrophoresis. (a) IgG kappa myeloma, (b) Controls showing total serum protein ...
 Expected Distribution of IQ Scores
 Data management questions