|
|
|

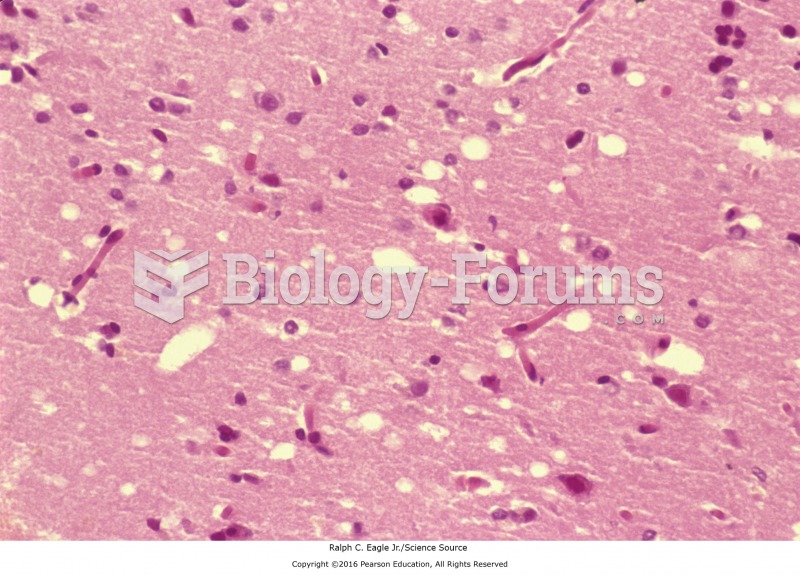 A histologic slide showing the sponge-like architecture of a patient with Creutzfeldt-Jakob Disease.
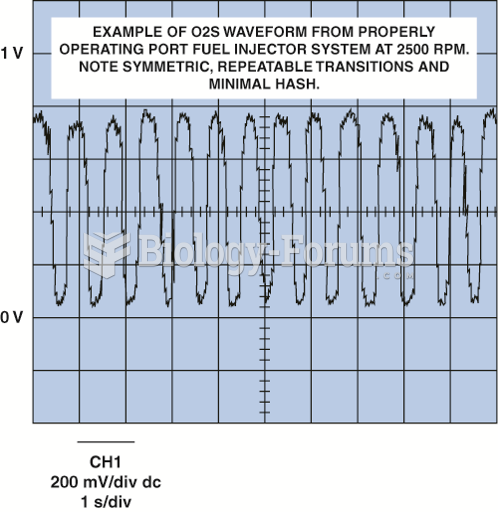 Normal oxygen sensor frequency is from about one to five times per second.
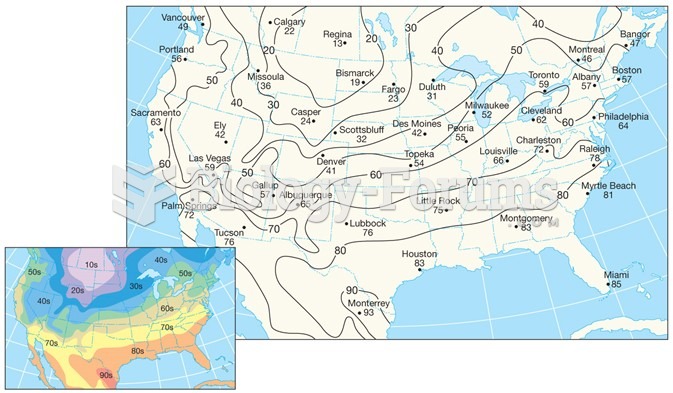 Air-Temperature Data
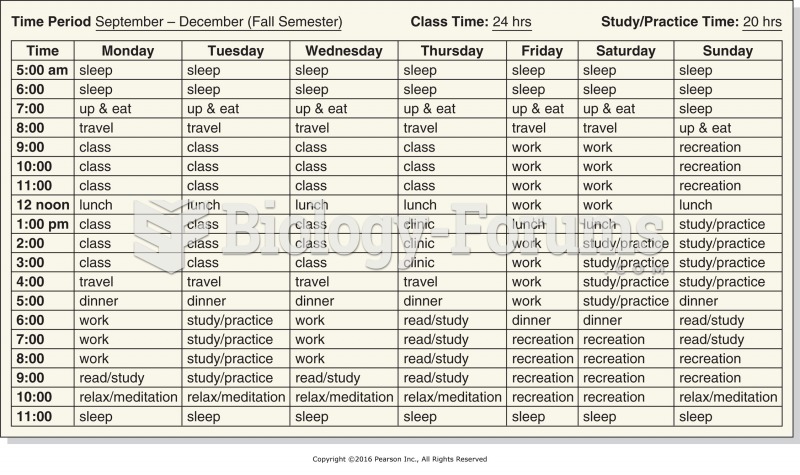 Sample time management planning chart for a massage student.
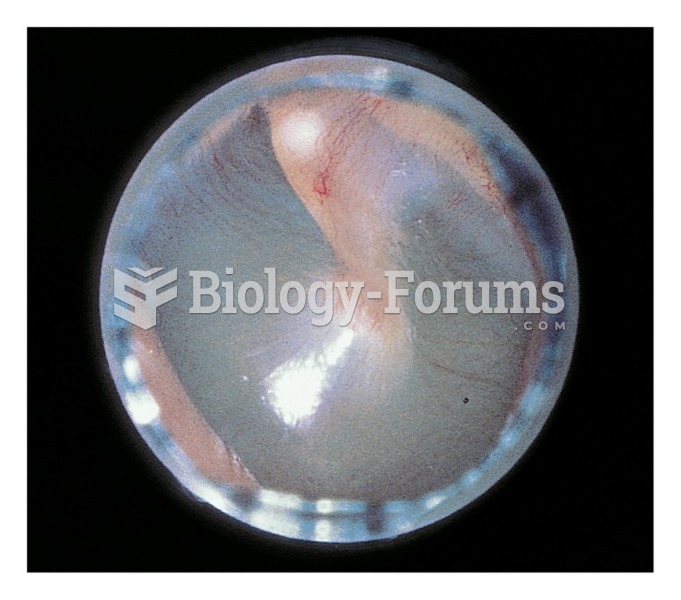 Normal tympanic membrane with cone of light and process of malleus
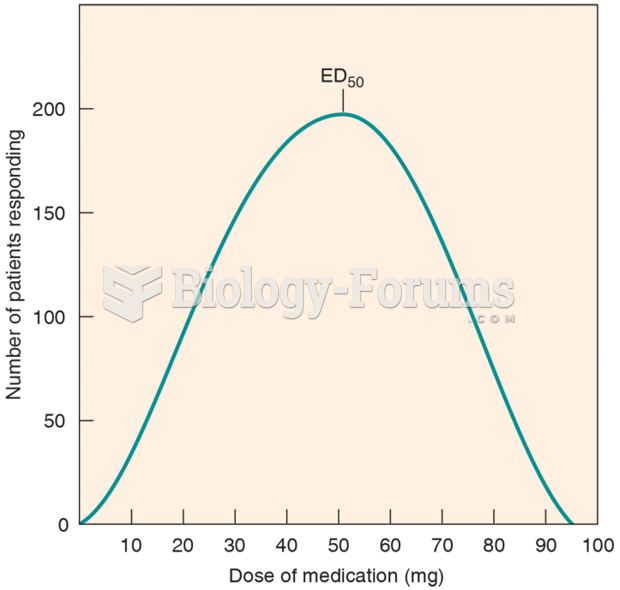 The Frequency Distribution Curve of a Drug