|
|
|

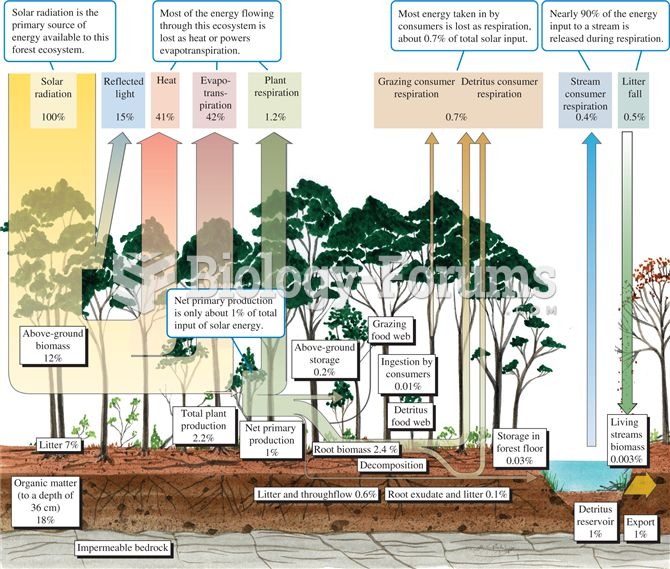 Energy budget for a temperate deciduous forest (data from Gosz et al. 1978).
 Summation of Heart Sounds, Normal S2
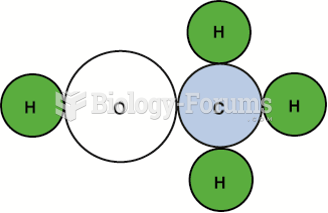 The molecular structure of methanol showing the one carbon atom, four hydrogen atoms, and one ...
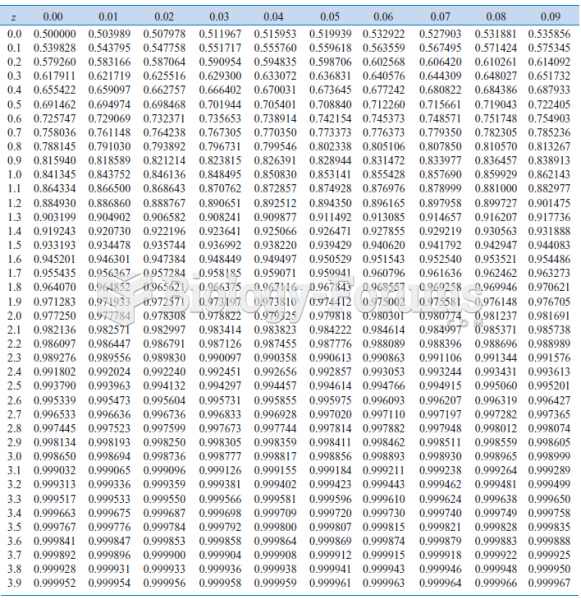 Cumulative Standard Normal Distribution
 Identical Twin Normal Birth Position
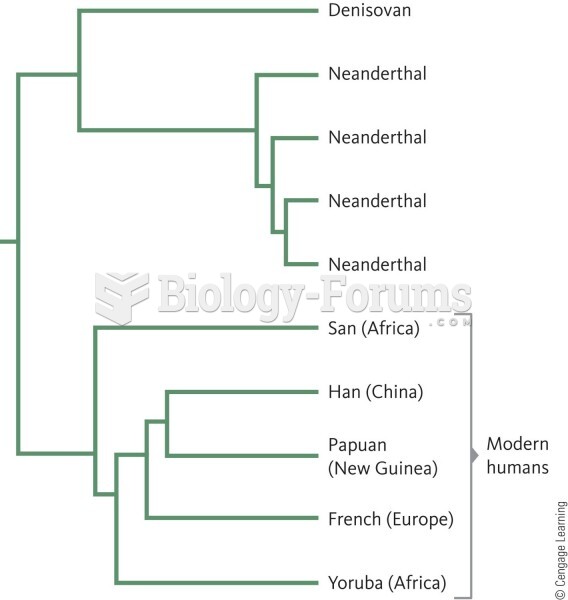 A phylogenetic tree showing that Denisovans were more closely related to Neanderthals than to member