|
|
|

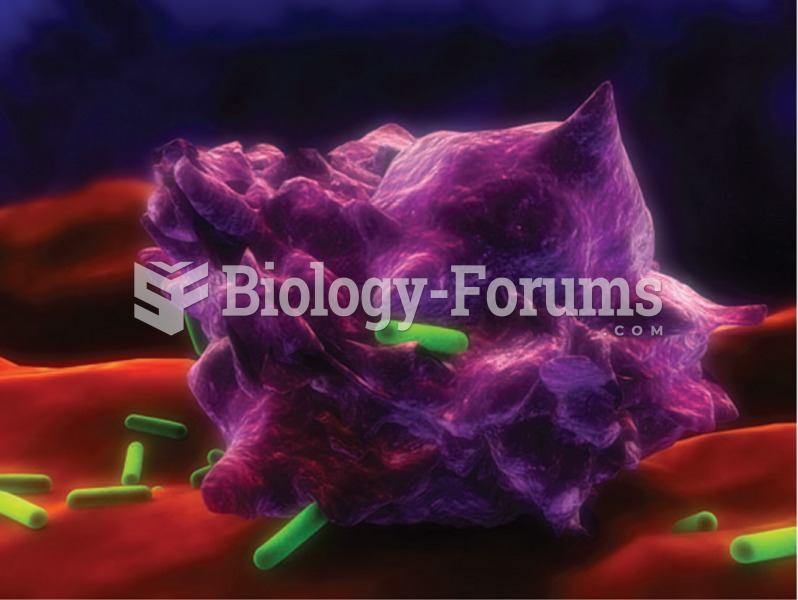 Enhanced photomicrograph showing a macrophage (purple) attack- ing bacillus Escherichia coli (green)
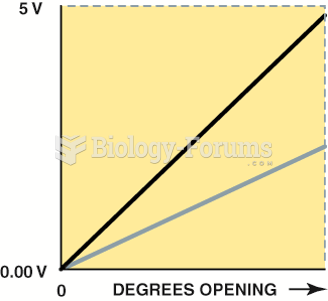 A typical accelerator pedal position (APP) sensor, showing two different output voltage signals ...
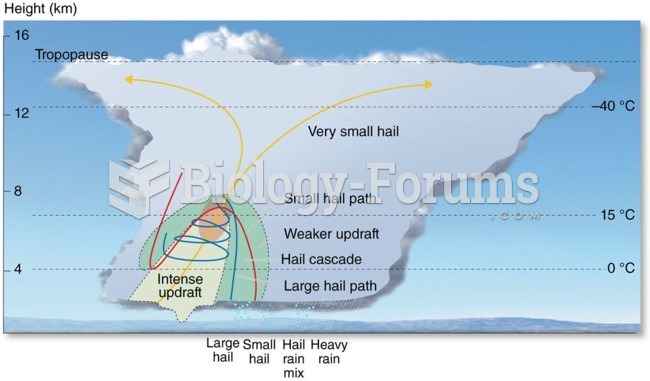 Distribution and Forms of Precipitation: Graupel and Hail
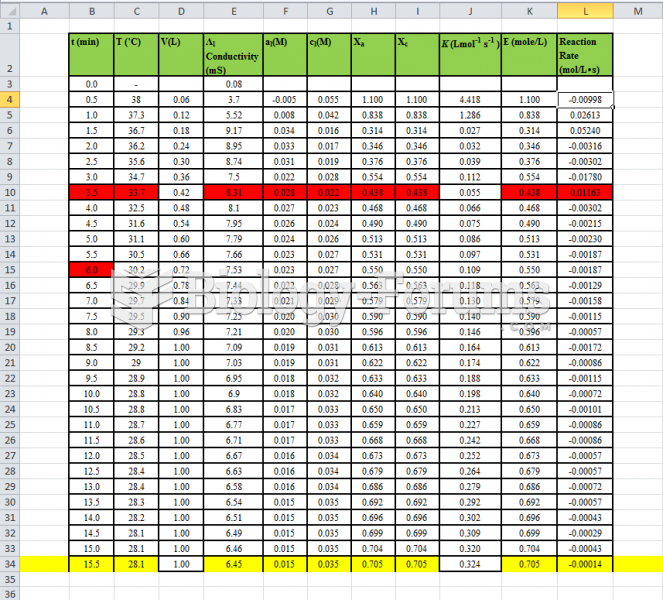 Fluidization - Data Table of experiment
 The frequency distribution of the allele in Africa, Southern Europe, the Middle East