|
|
|

 Your Culture and Your Point of View
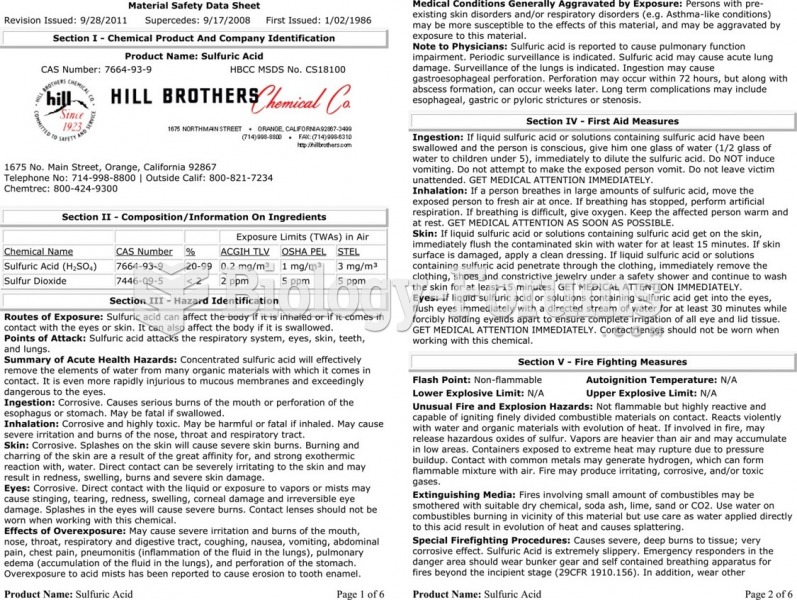 The material safety data sheet (MSDS) for sulfuric acid showing the detailed technical information ...
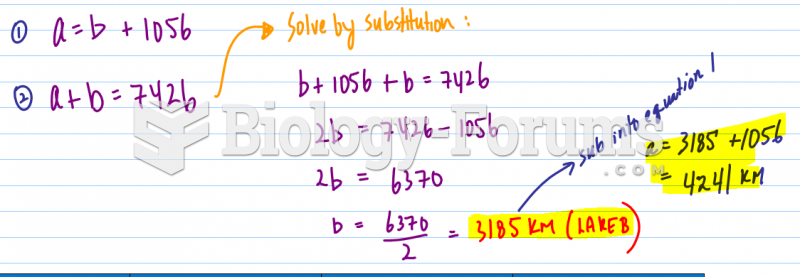 Finding the length given total distance and distance longer than other point
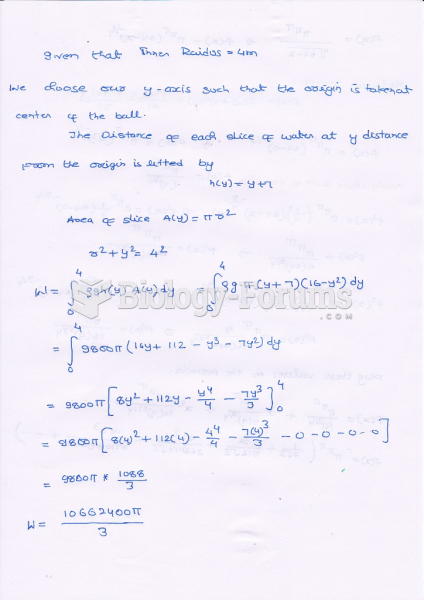 A spherical water tank with an inner radius of 4 m has its lowest point 3 m ...
 Constructing a Three-Point Recombination Map
 Constructing a Three-Point Recombination Map