|
|
|

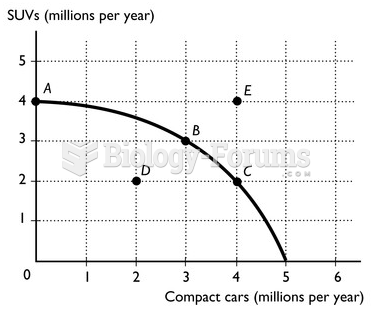 graph
graph
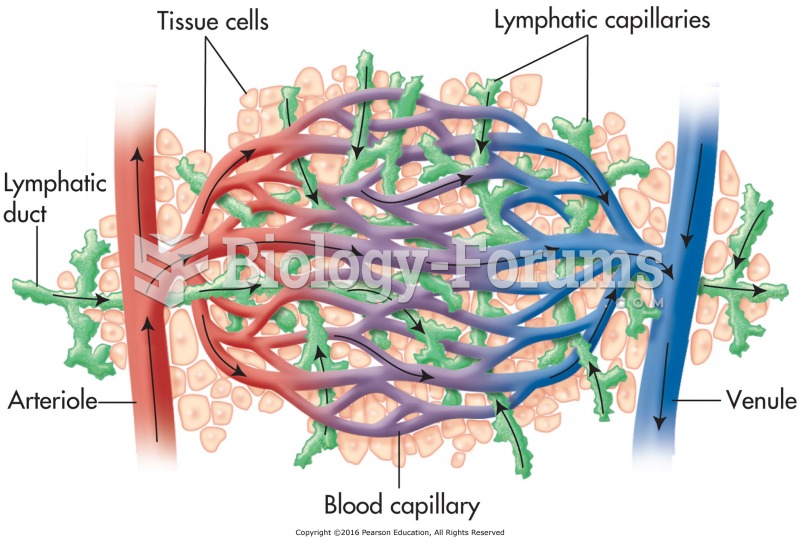 Relationship of the lymphatic system to the cardiovascular system.
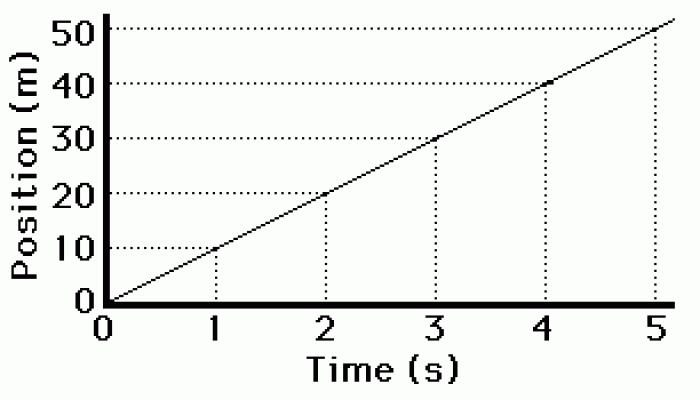 Velocity-time Graph
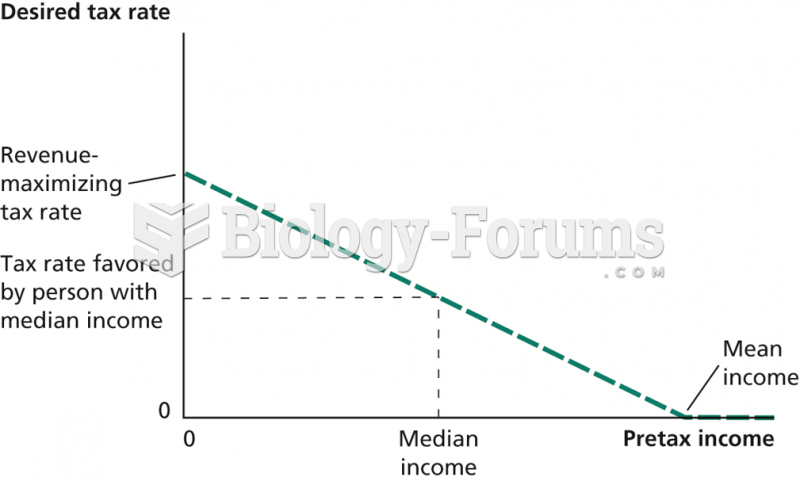 Relationship between Income Inequality and the Desired Tax Rate
 calculus homework graph help please
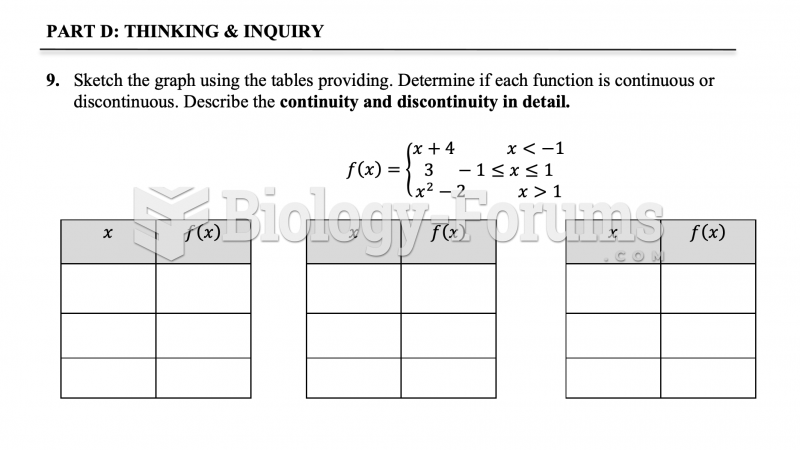
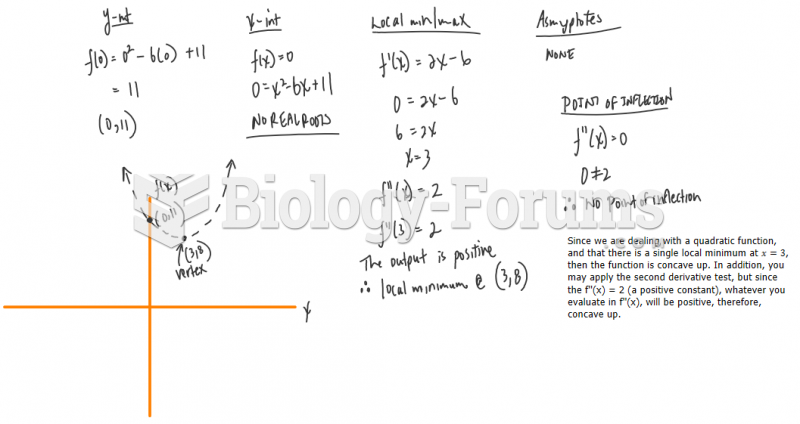 Sketch the graph of the following functions using local maximum/minimums, interc