This topic contains a solution. Click here to go to the answer
|
|
|

 Cade and colleagues discovered a way to improve athletic performance and prevent salt and water imba
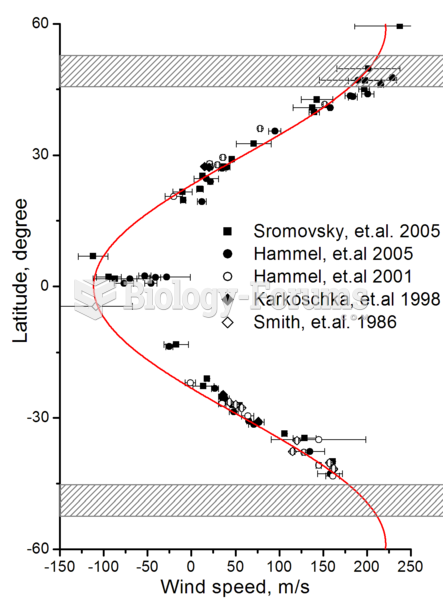 Zonal wind speeds on Uranus. Shaded areas show the southern collar and its future northern counterpa
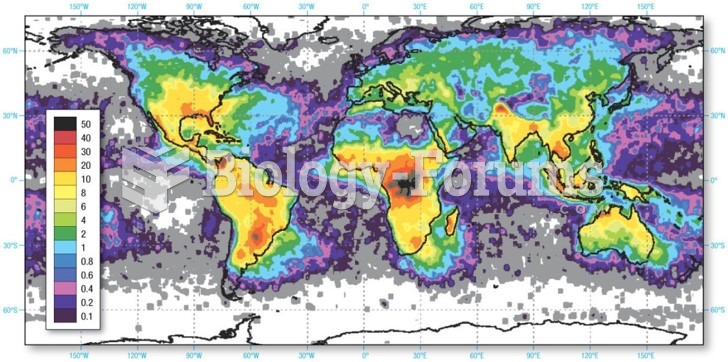 Annual Mean Number of Days with Thunder
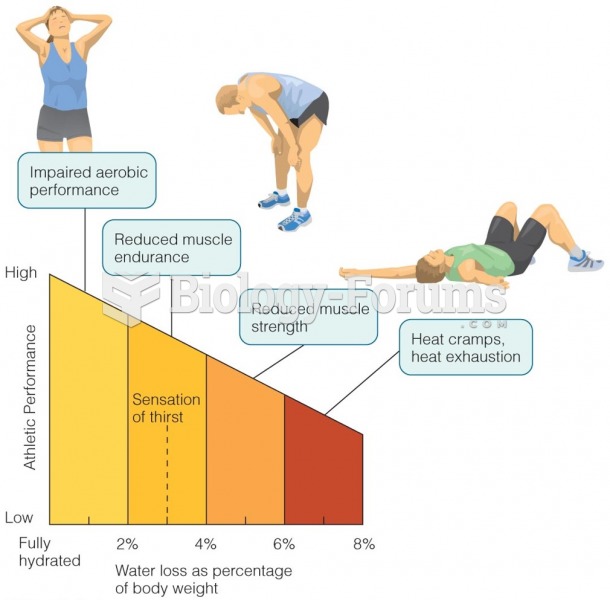 Effects of Dehydration on Exercise Performance
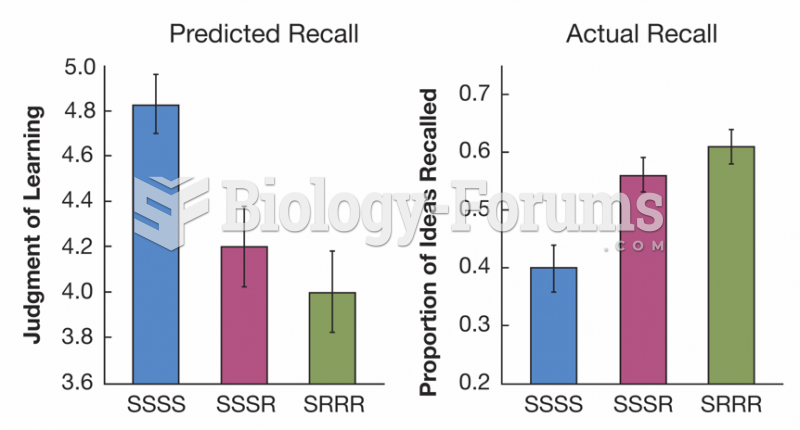 Effects of Retrieval Practice on Predicted and Actual Memory Performance
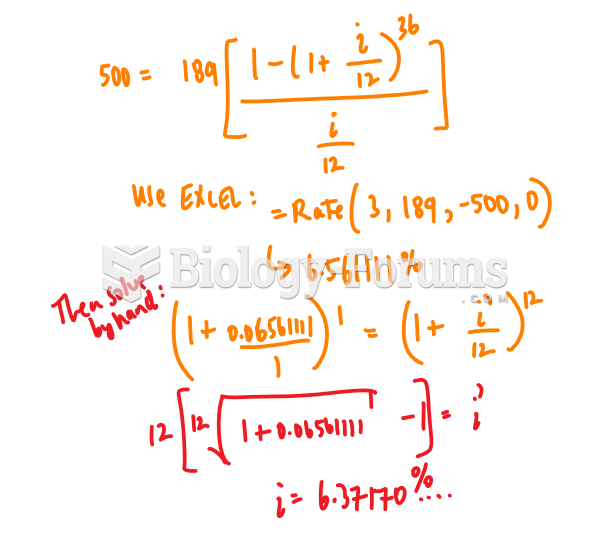 Determine the nominal annual rate of interest of the following ordinary general annuity.