|
|
|

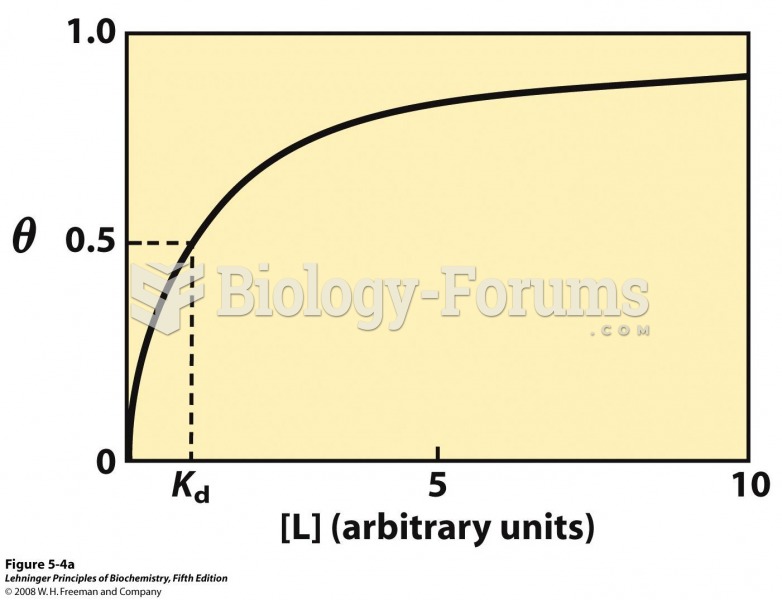 Graphical representations of ligand binding
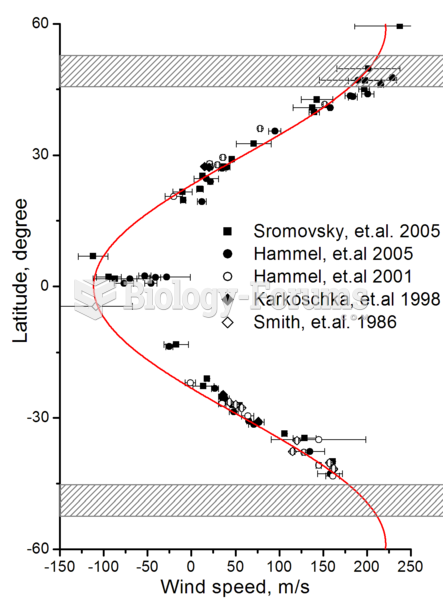 Zonal wind speeds on Uranus. Shaded areas show the southern collar and its future northern counterpa
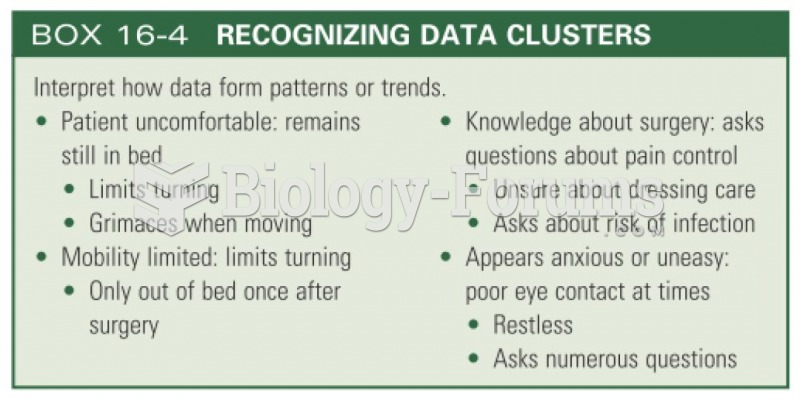 Recognizing data clusters
 Analyzing a medical term.
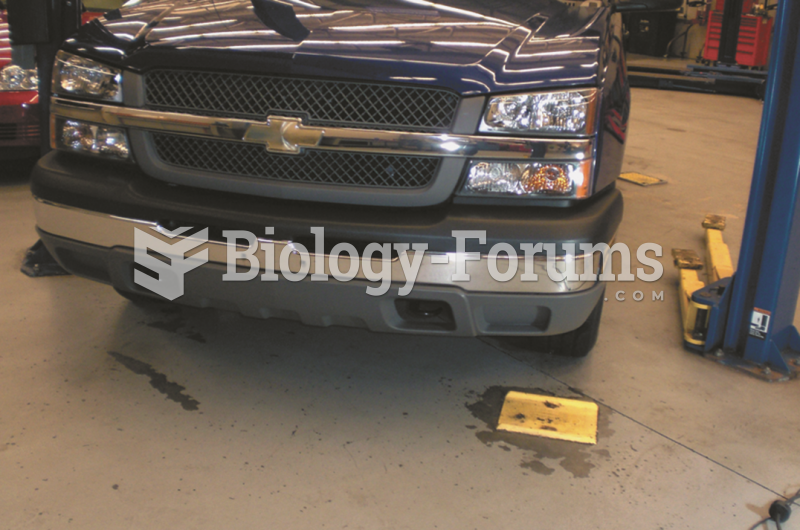 The first step in hoisting a vehicle is to properly align the vehicle in the center of the stall.
 Apply the substance to the client’s posterior leg with one smooth stroke. To stabilize the ...