|
|
|

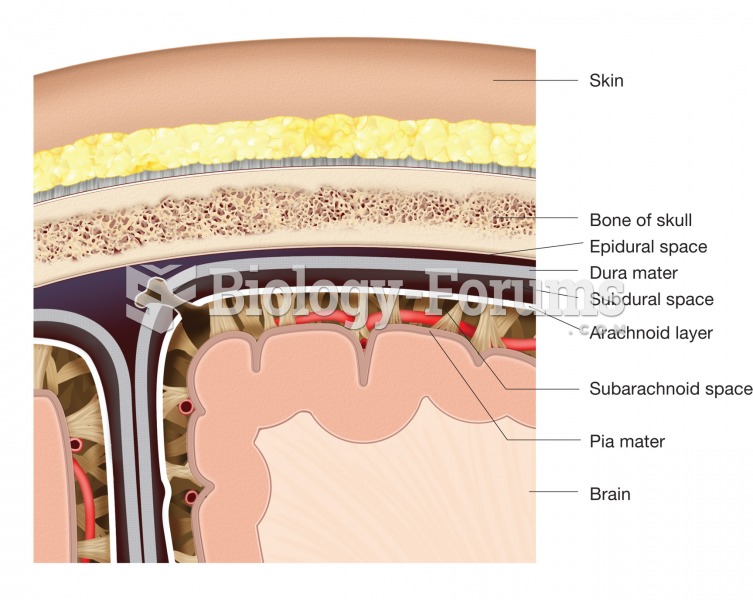 The meninges. This figure illustrates the location and structure of each layer of the meninges and t
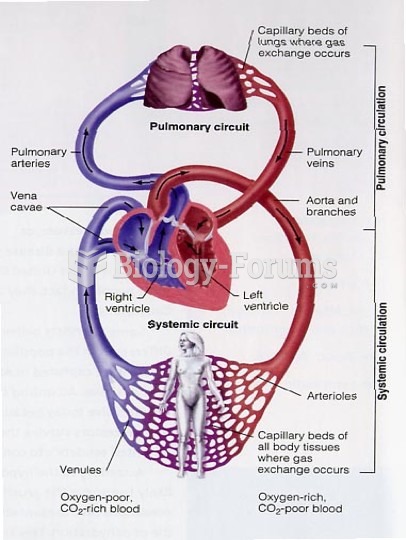 Fetal Circulation Diagram
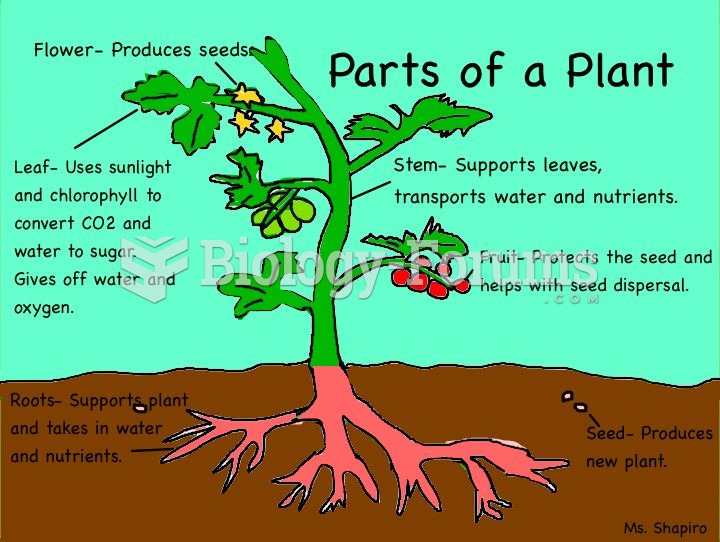 Plant Diagram
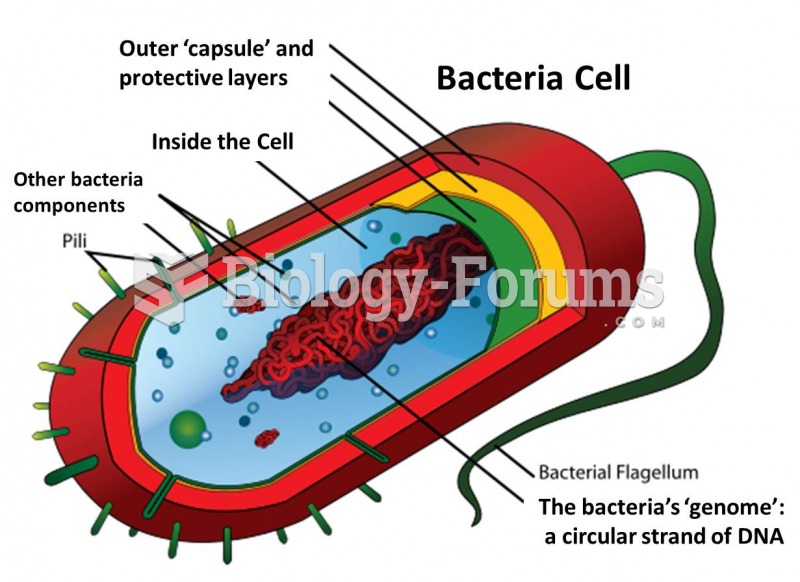 Bacteria Diagram
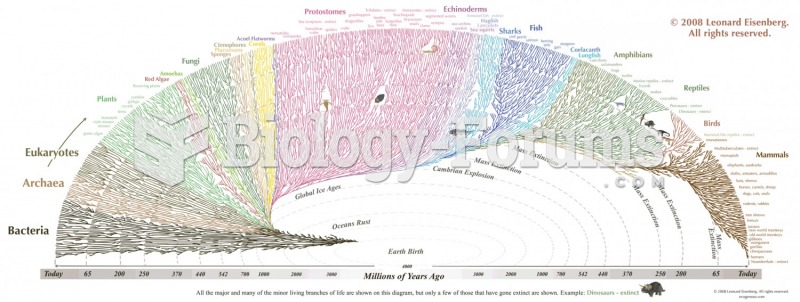 awesome diagram on evolution and diversity
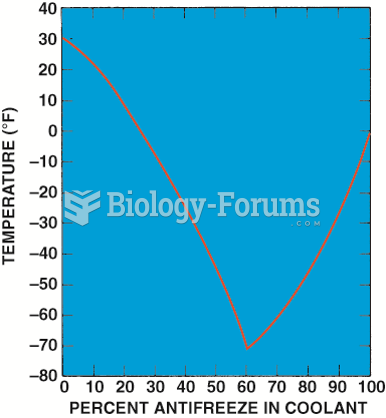 Graph showing the relationship between the freezing point of the coolant and the percentage of ...