|
|
|

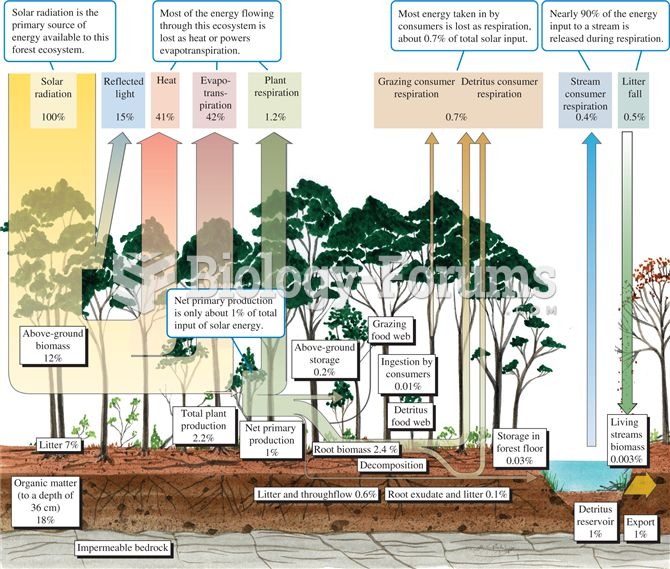 Energy budget for a temperate deciduous forest (data from Gosz et al. 1978).
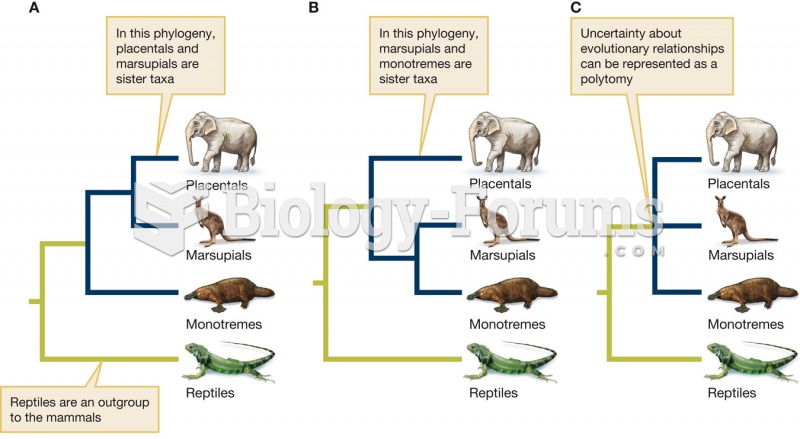 Polytomies represent uncertainty about phylogenetic relationships
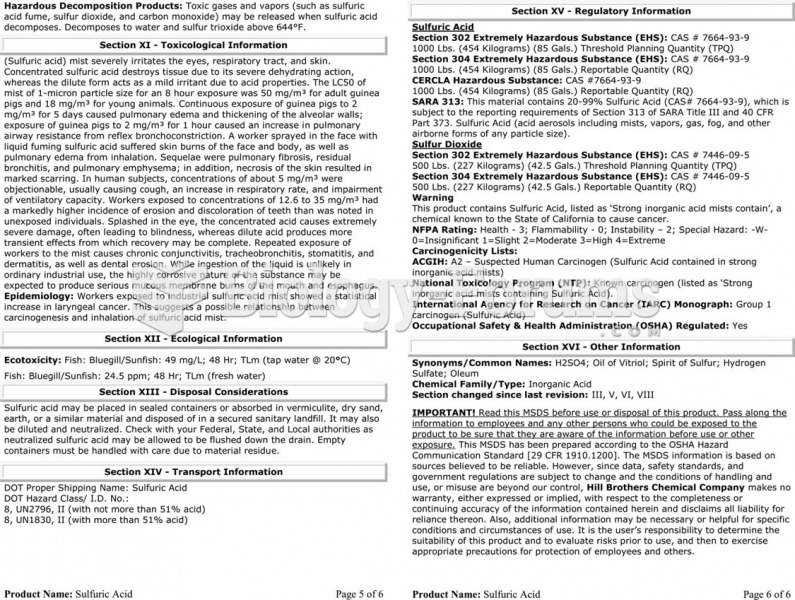
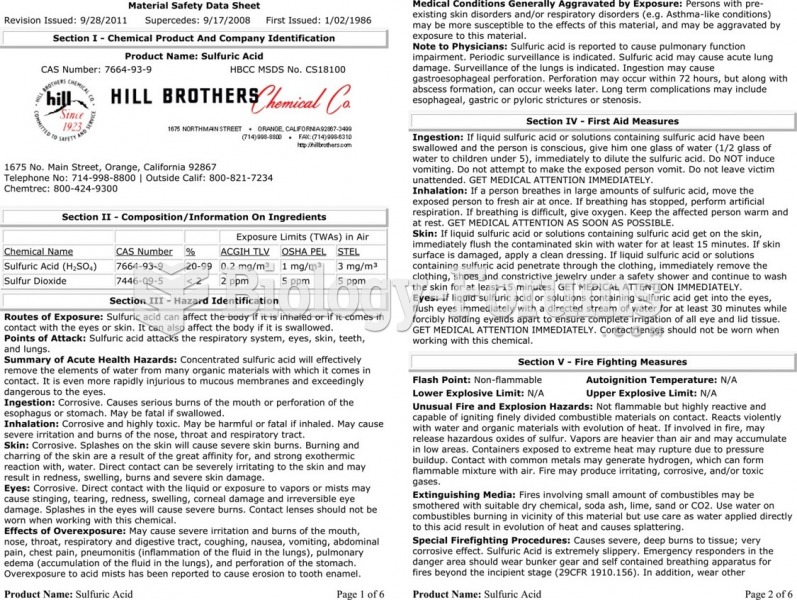 The material safety data sheet (MSDS) for sulfuric acid showing the detailed technical information ...
 The material safety data sheet (MSDS) for sulfuric acid showing the detailed technical information ...
 How to calculate the mean for grouped data
 Midsagittal section indicating locations of true and false pelves