|
|
|

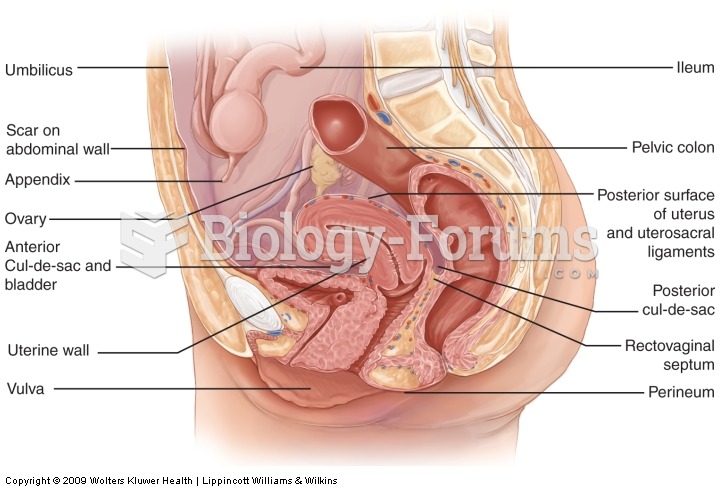 Common sites of endometriosis formation.
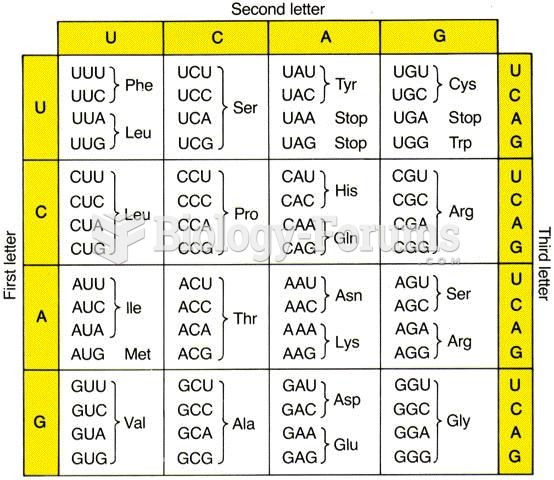 Codon Chart
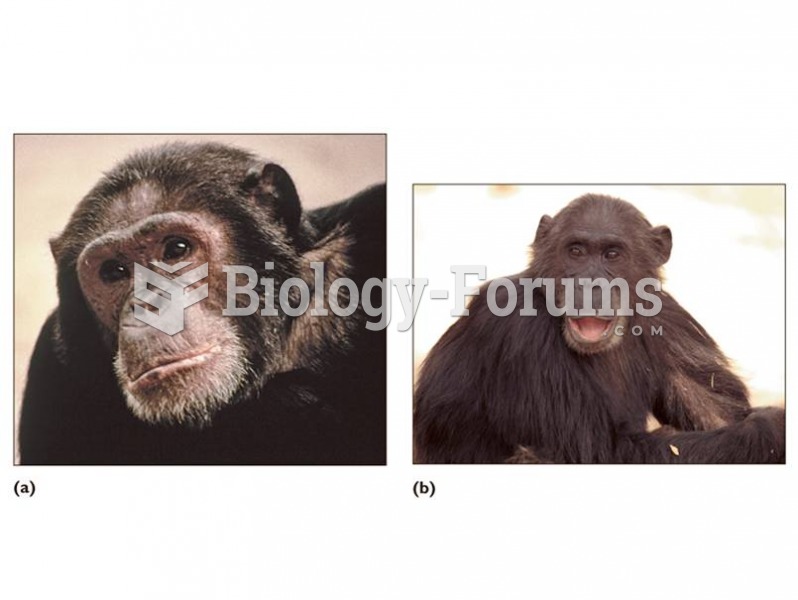 (a) Chimpanzees and (b) bonobos likely diverged from a common ancestor due to allopatric speciation
 An ECT sensor being tested using a digital meter set to DC volts. A chart showing the voltage ...
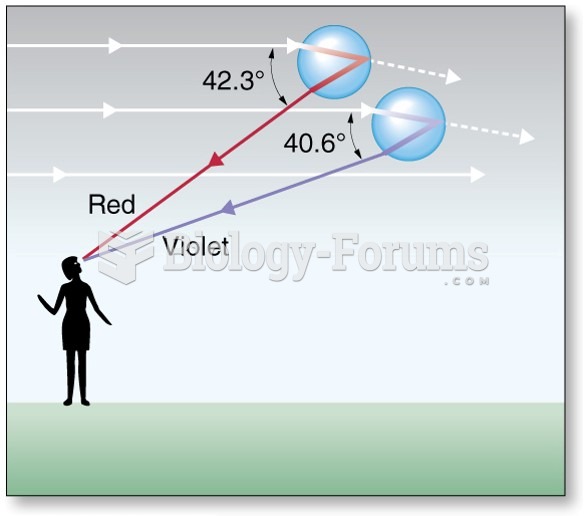 Primary rainbows are the brightest and most common.
 Common Abbreviations and Symbols Used by Massage Therapists Cont