This topic contains a solution. Click here to go to the answer
|
|
|

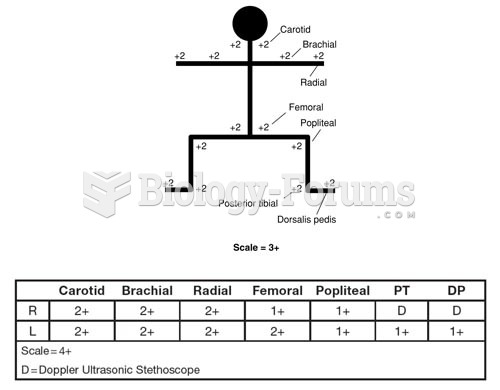 Methods to Document Peripheral Pulses A. Stick Figure Peripheral Pulse Documentation B. Tabular Peri
 This chart illustrates the bottom up assumption about government. In this, attitudes, culture, and
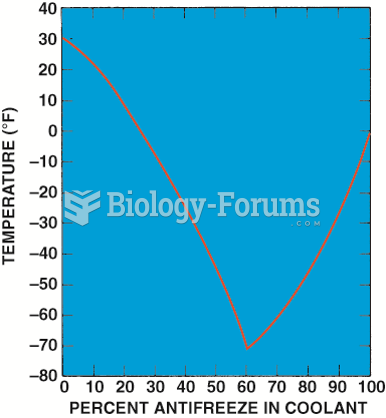 Graph showing the relationship between the freezing point of the coolant and the percentage of ...
 Relationship between Trust and Investment
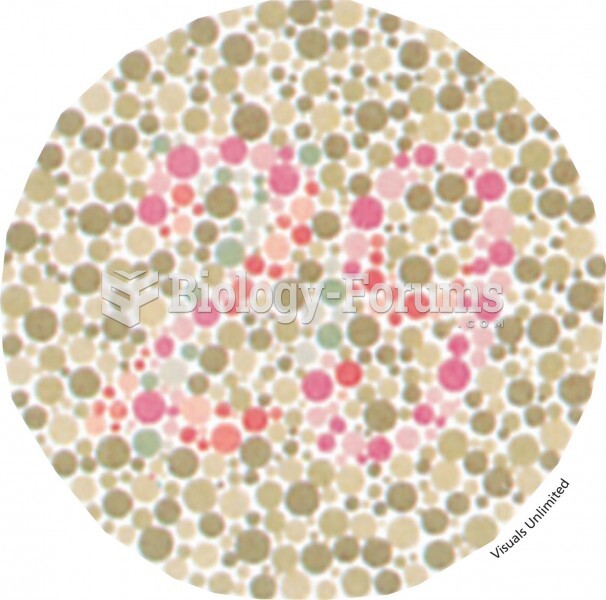 People with normal color vision see the number 29 in the chart; however, those who are color-blind c
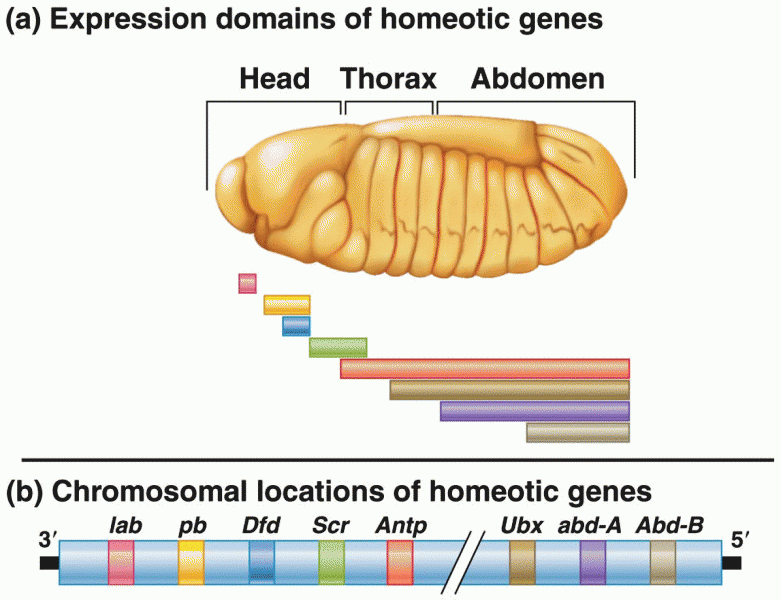 The colinear relationship