Answer to Question 1
D
Answer to Question 2
There are several clues to the presence of multicollinearity: (1) an independent variable known to be an important predictor ends up having a partial regression coefficient that is not significant; (2) a partial regression coefficient exhibits the wrong sign; and/or, (3) when an independent variable is added or deleted, the partial regression coefficients for the other variables change dramatically. A more practical way to identify multicollinearity is through the examination of a correlation matrix, which is a matrix that shows the correlation of each variable with each of the other variables. A high correlation between two independent variables is an indication of multicollinearity.

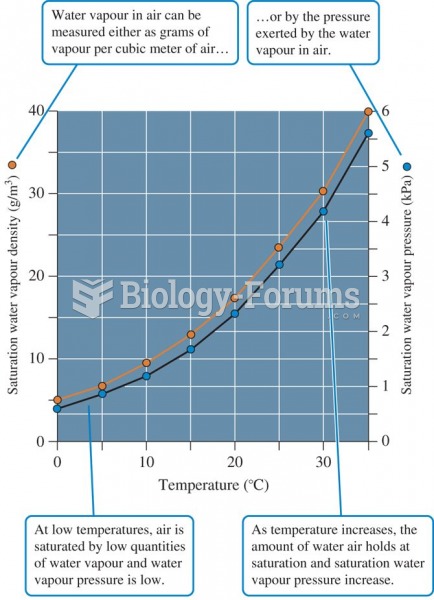 The relationship between air temperature and two measures of water vapour saturation of air.
 The vagina, sagittal section showing the location of the vagina and its relationship to the cervix,
 Relationship between a diagnostic label and related factor
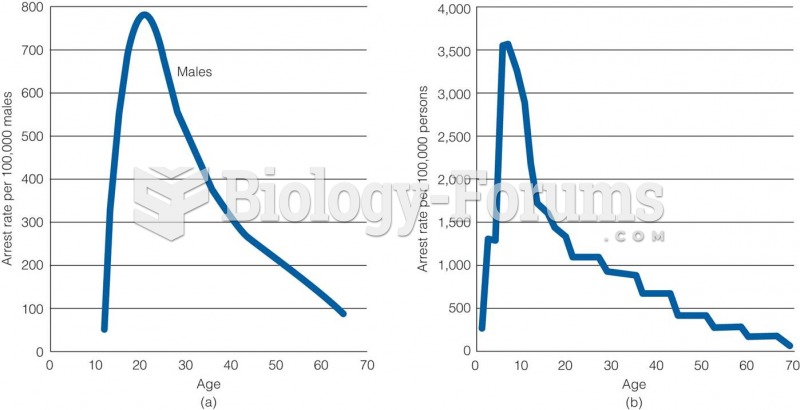 Age-Crime Relationship in (a) 1842 and (b) 1992
 Relationship Between Physical Activity and Improved Health Benefits
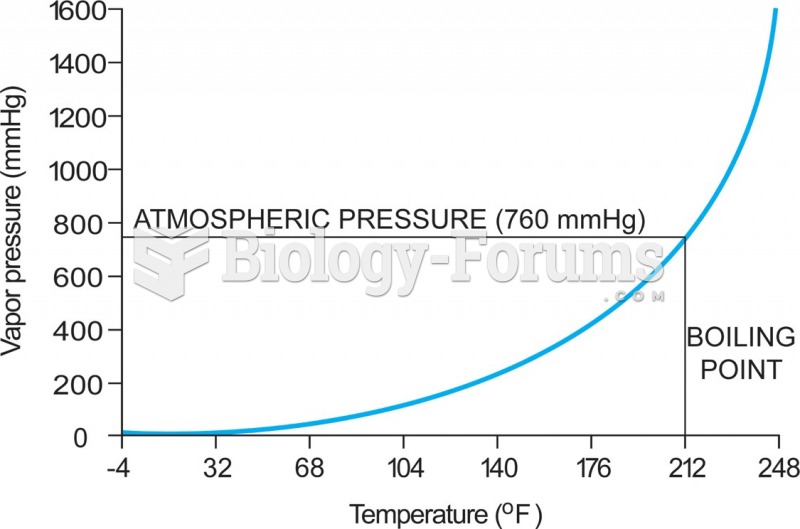 5-4 The relationship between vapor pressure and temperature—in this case for water. As the ...