|
|
|

Did you know?
Methicillin-resistant Staphylococcus aureus or MRSA was discovered in 1961 in the United Kingdom. It if often referred to as a superbug. MRSA infections cause more deaths in the United States every year than AIDS.

 Relationship between fruit radius and beak length in populations of native and introduced species of
 A graphical representation of the marginal value theorem.
 Relationship between levels of COHb in blood and concentration of CO in the surrounding air
 The overlapping relationship among research, evidence-based practice
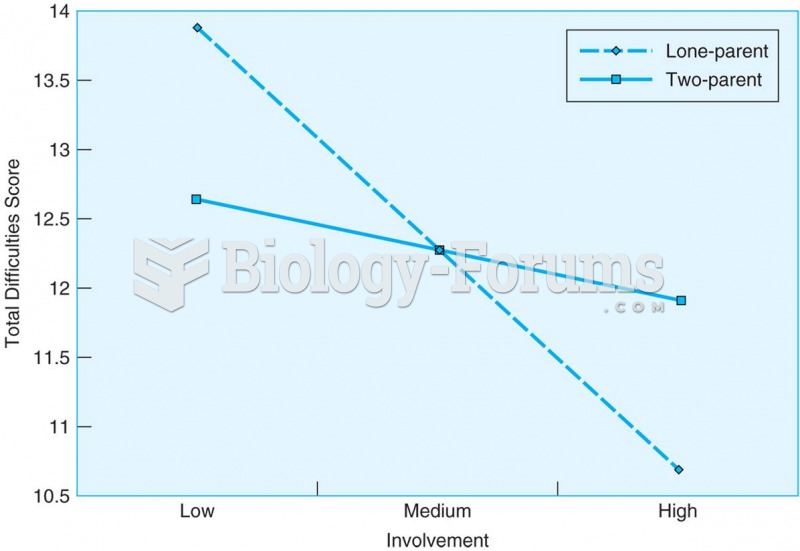 When teenagers live in single-parent homes, a good relationship with grandparents is related to ...
 Relationship between birth weight and mortality in humans