|
|
|

 Pupil assessment; A, starting position, with penlight to side of pupil;
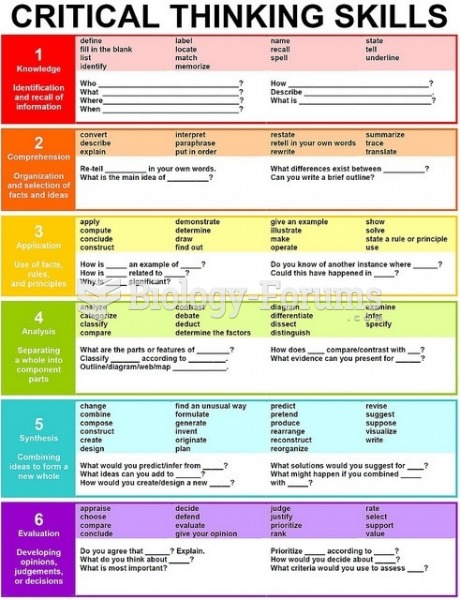 Critical Thinking Skills chart
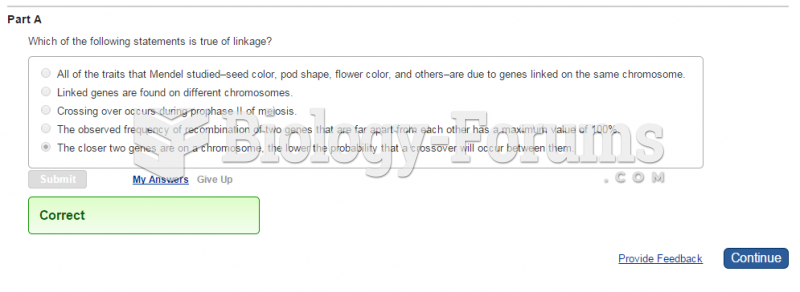 Which of the following statements is true of linkage?
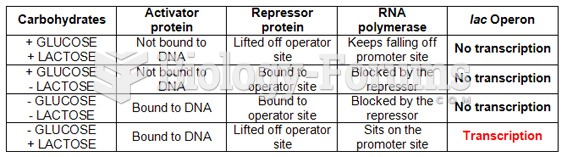 Lactose Operon Summary Chart
 Demographic Data for Nigeria
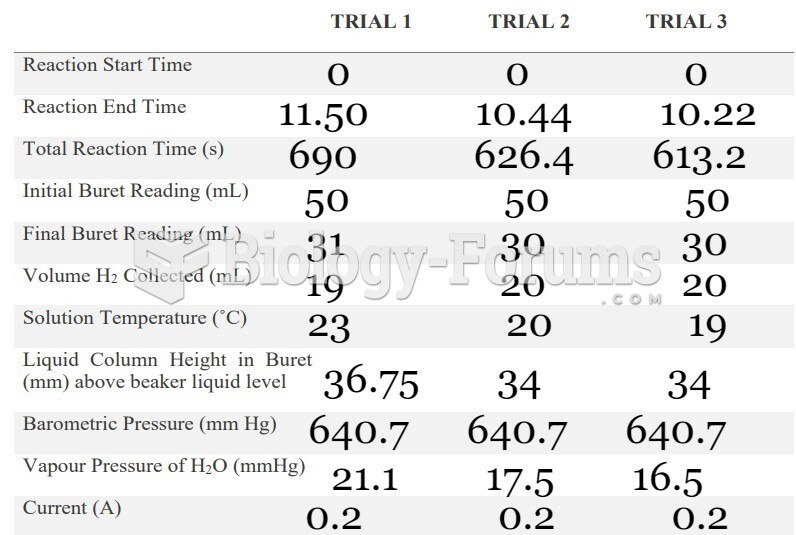 data
data