This topic contains a solution. Click here to go to the answer
|
|
|

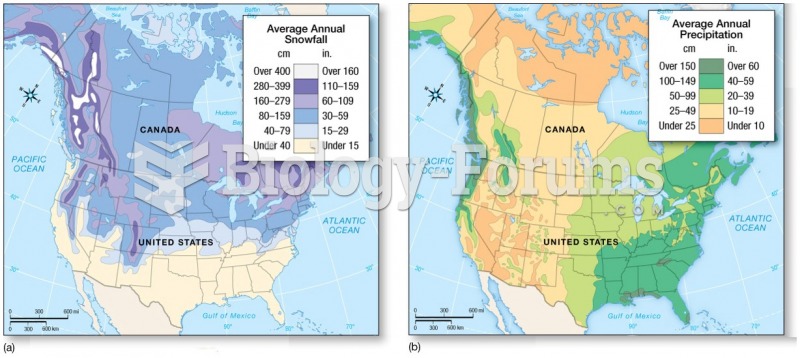 Distribution and Forms of Precipitation: Snow
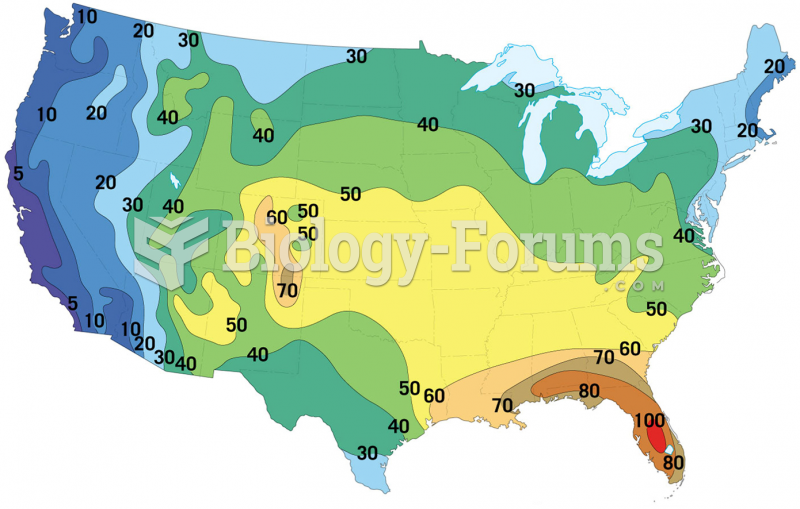 Average Number of Days per Year with Thunderstorms
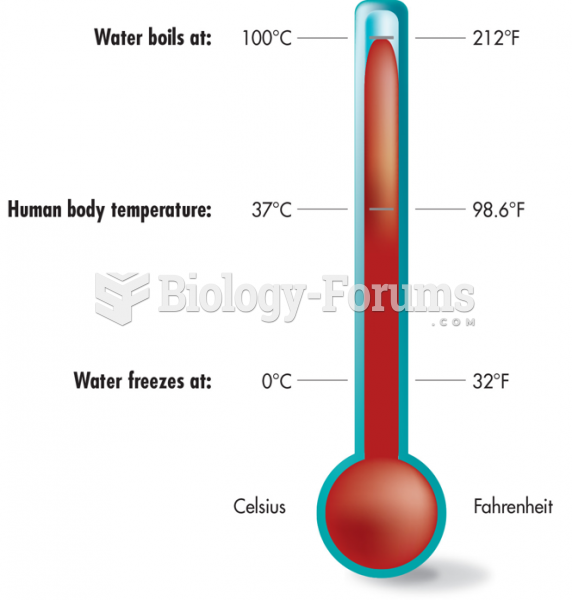 Thermometer Showing the Temperatures
 graph
graph
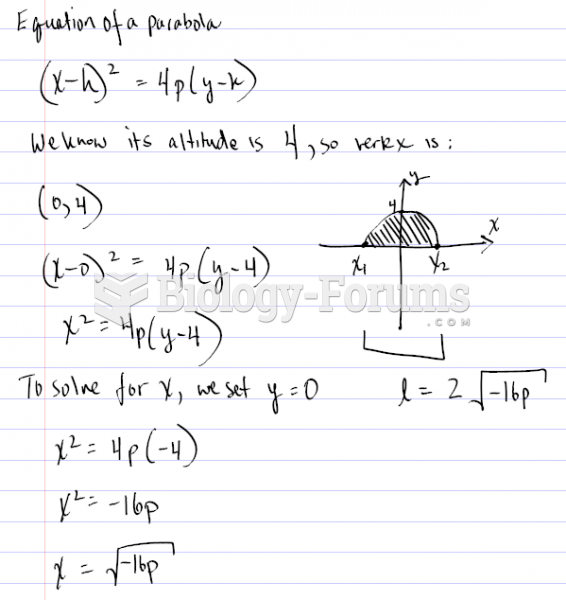 Finding the graph of a Parabola using certain values
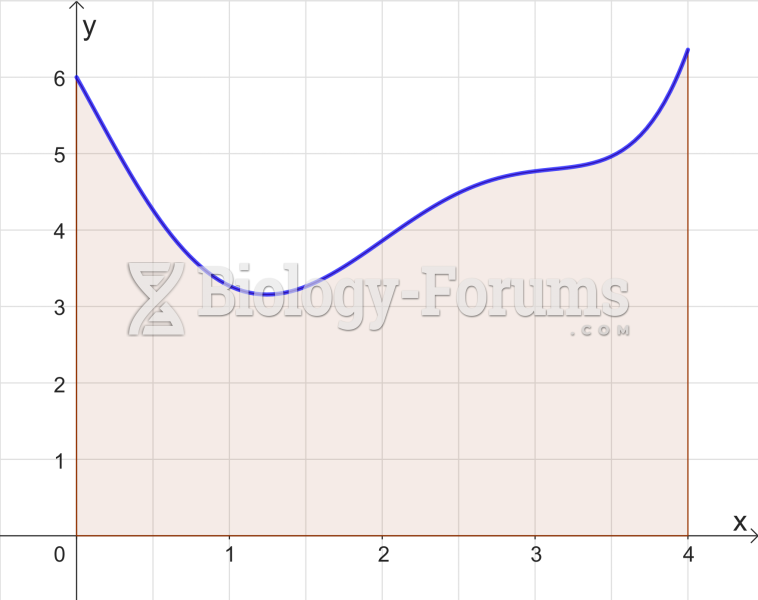 Trapezoidal Rule Graph