This topic contains a solution. Click here to go to the answer
|
|
|

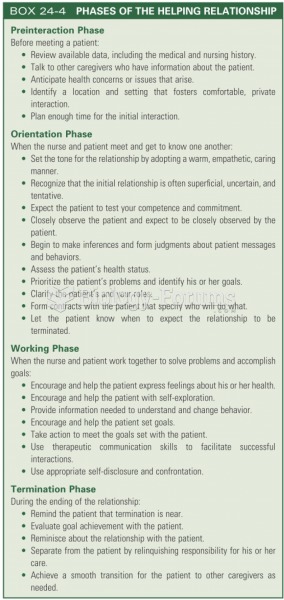 Phases of the working relationship
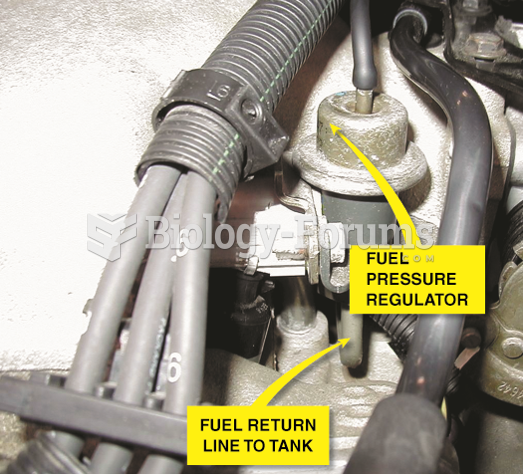 Fuel should be heard returning to the fuel tank at the fuel return line if the fuel pump and ...
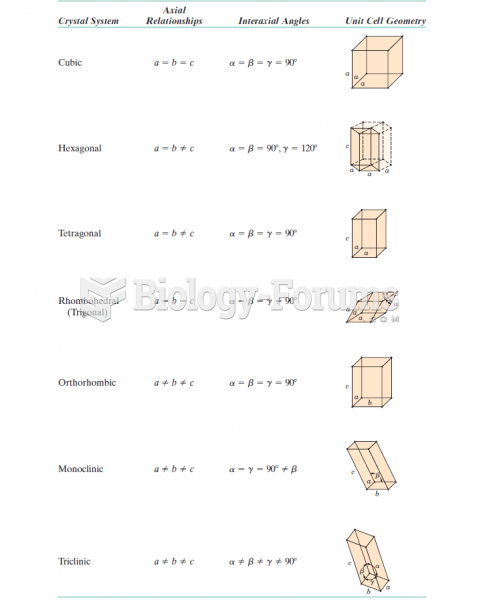 Lattice Parameter Relationships and Figures Showing Unit Cell Geometries for the Seven Crystal Syste
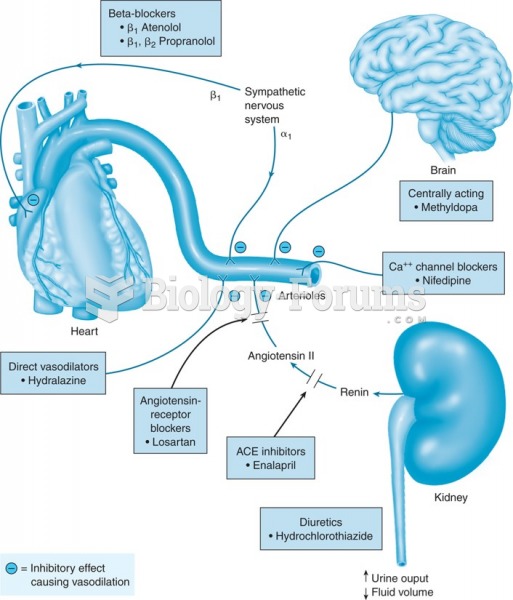 Diagram showing the sites of action of different antihypertensive drugs.
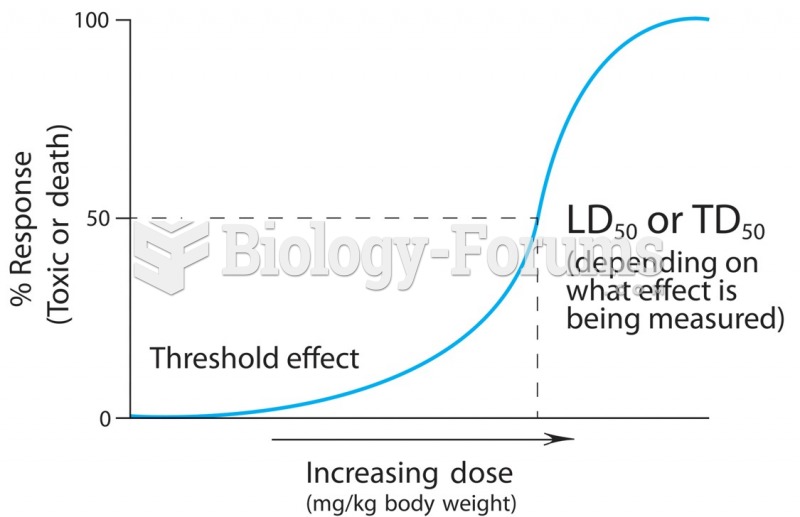 A dose-response curve describes the relationship between the quantity of the chemical entering the ...
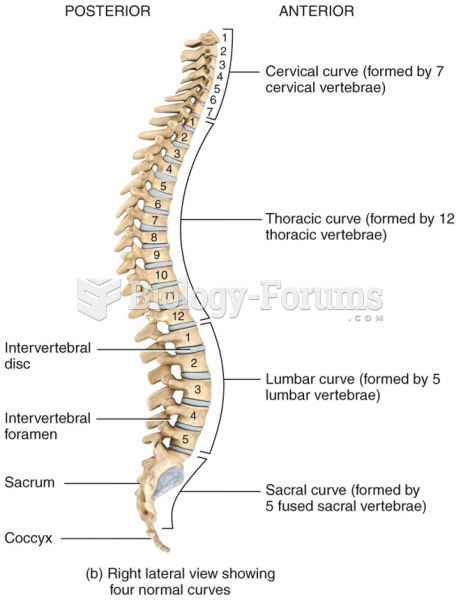 Right lateral view showing low normal curves of the vertebral column