|
|
|

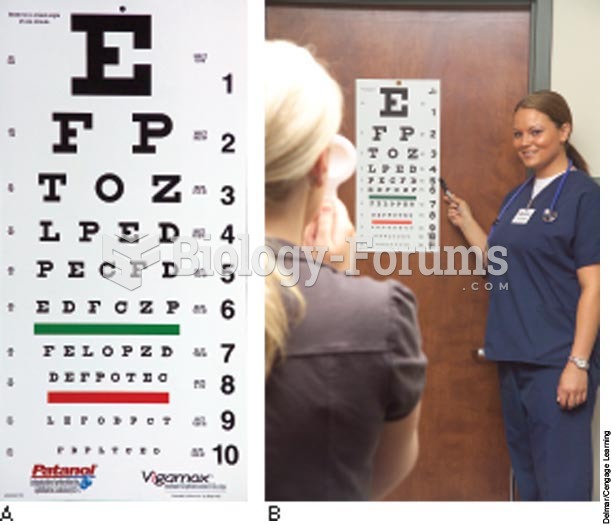 Snellen chart
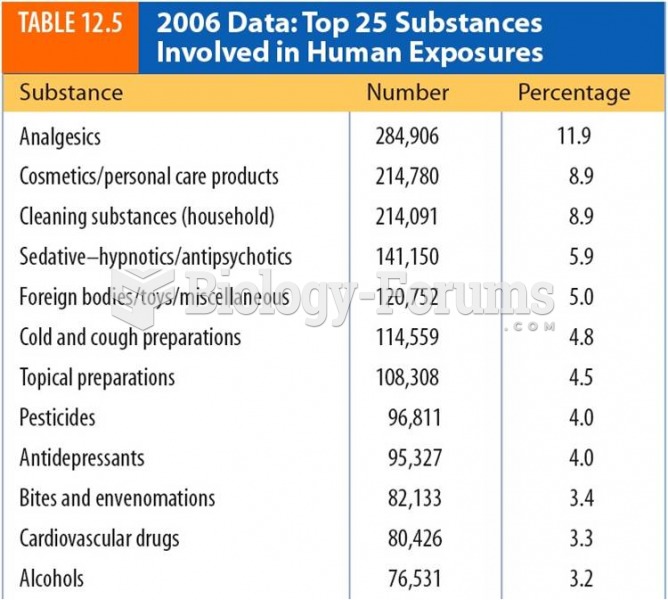 2006 Data:Top 25 Substances Involved in Human Exposures
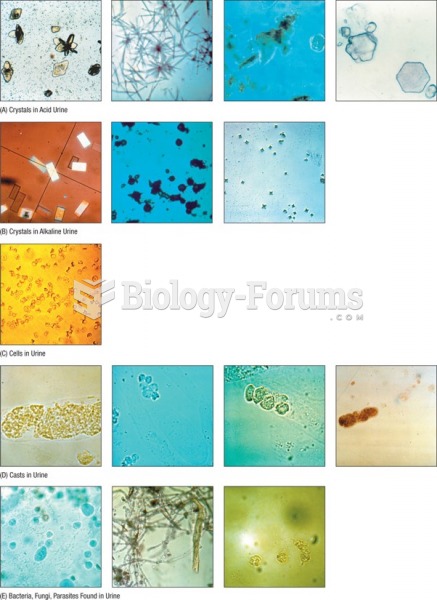 Urine sediment chart.
 Adding additional amounts of ethyl alcohol (ethanol) increases the frequency reading.
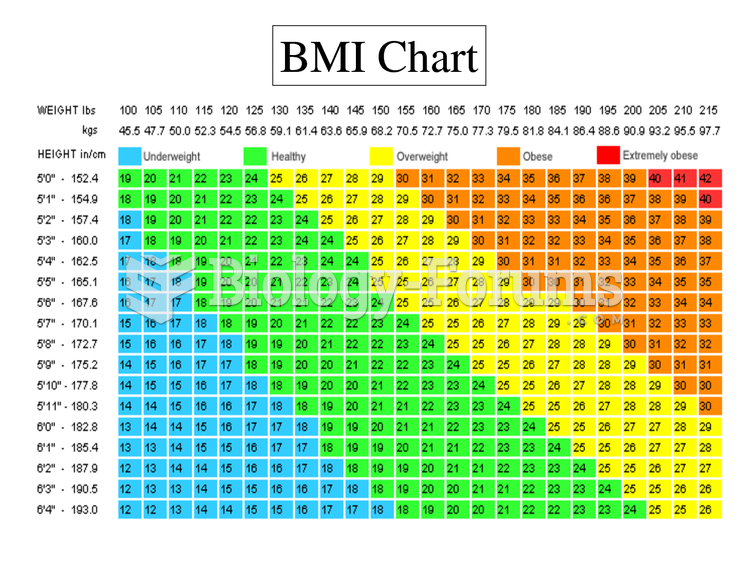 BMI Chart Weight Chart
 A hypothetical grid of data used in synteny testing