|
|
|

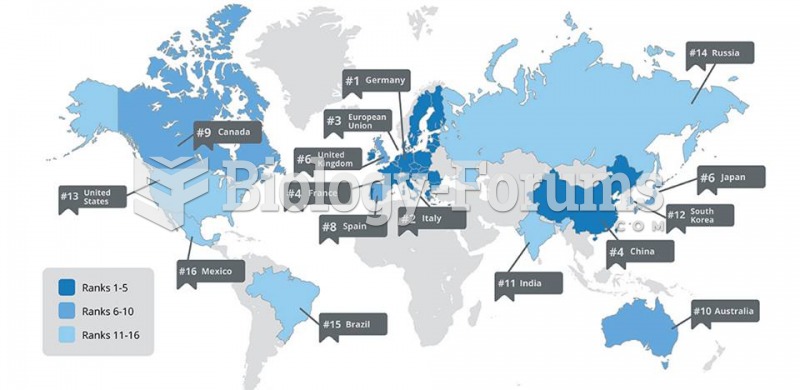 Energy Chart
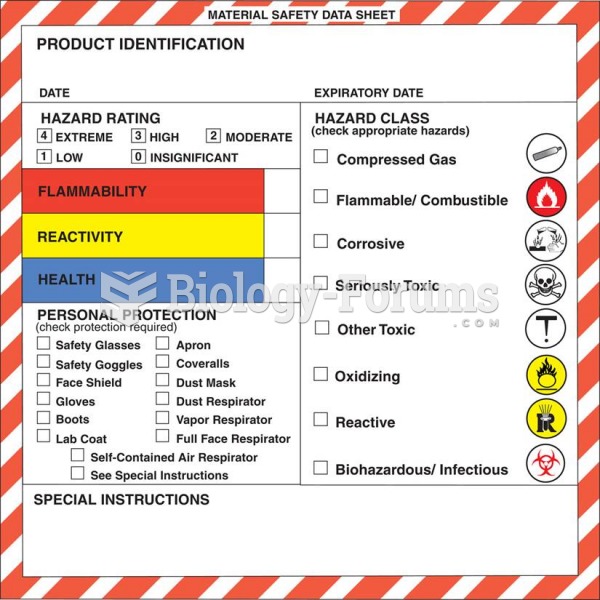 An example of a Material Safety Data Sheet (MSDS).
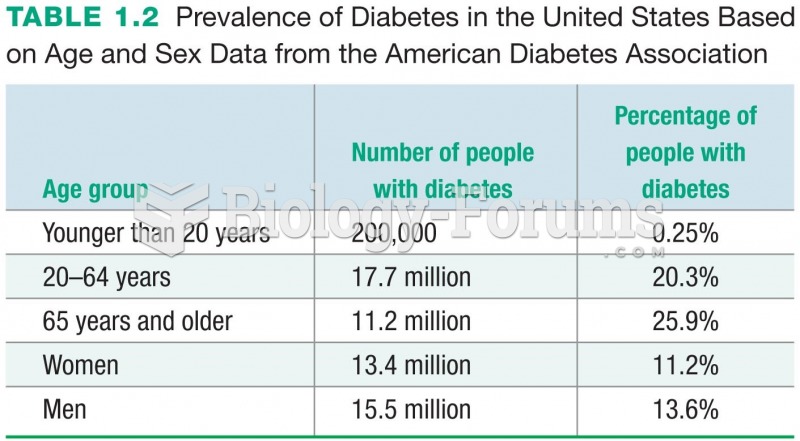 Prevalence of Diabetes in the United States Based on Age and Sex Data from the American Diabetes ...
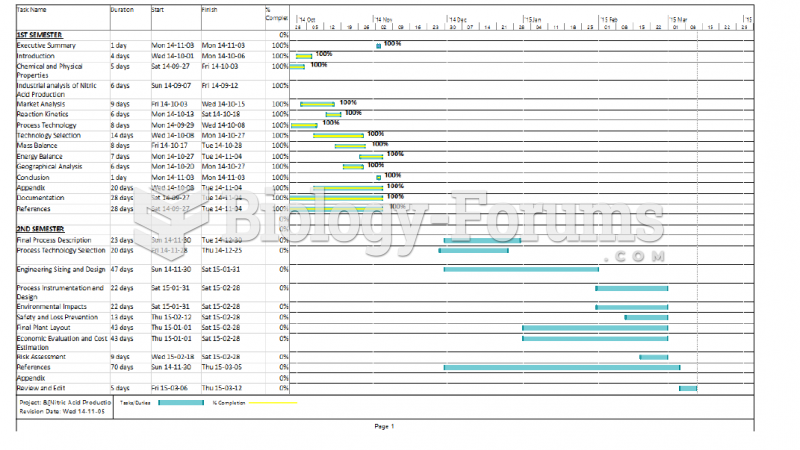 Gantt Chart
 A mobile weather station that can be used to gather current weather data at the scene of hazardous ...
 The frequency distribution of the allele in Africa, Southern Europe, the Middle East