|
|
|

 As China has embraced its version of capitalism, wealth has grown, as has consumption. Luxury goods ...
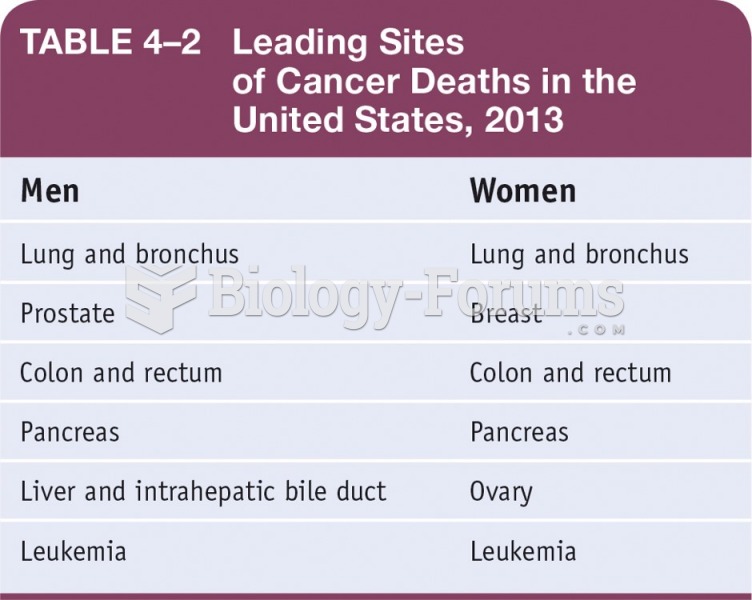 Leading Sites of Cancer Deaths in the United States, 2013
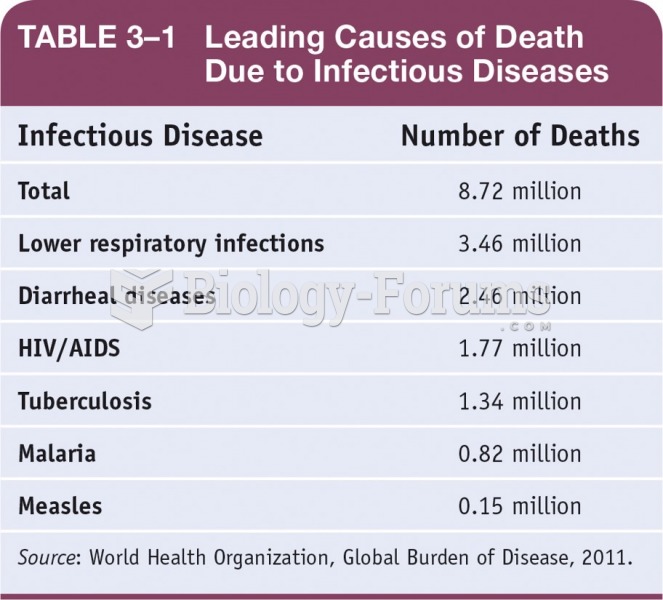 Leading Causes of Death Due to Infectious Diseases
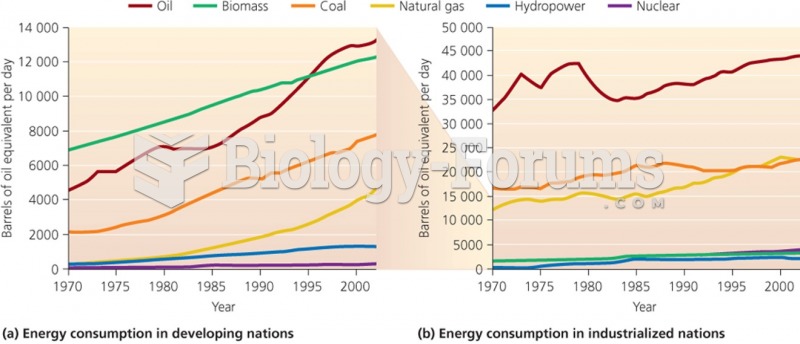 Comparison of energy consumption in developing and industrialized nations
 Cultural Attitudes Toward Insect Consumption
 Depictions of the transformations leading to the supercoiling of circular DNA