|
|
|

 Gorillas live in one-male or multimale groups, from which females emigrate at sexual materity.
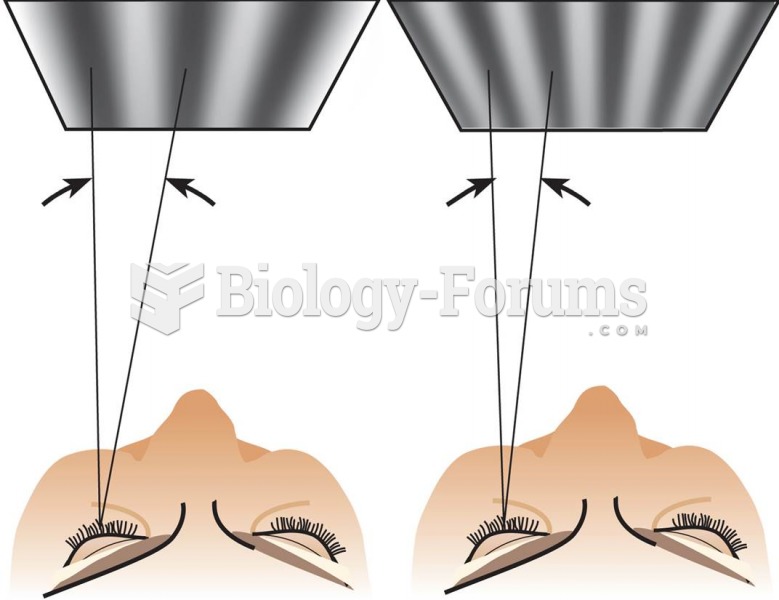 Visual Angle and Spatial Frequency
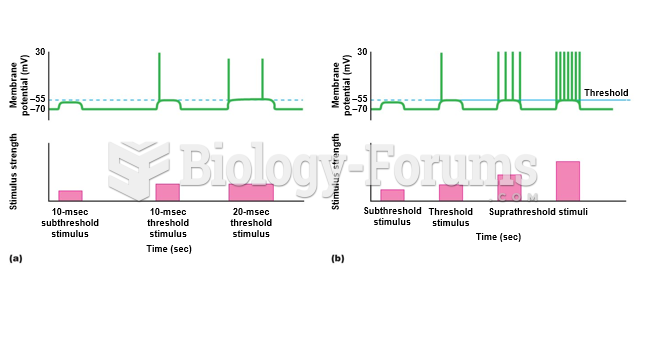 Frequency coding: how action potentials convey intensity of stimuli.
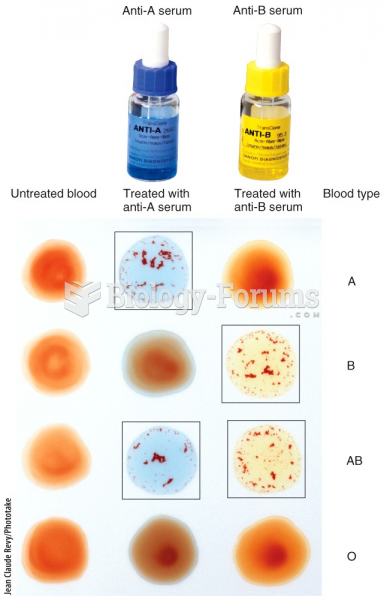 Blood Groups and Blood Types
 Frequency Analysis of Letters Used in the English Language
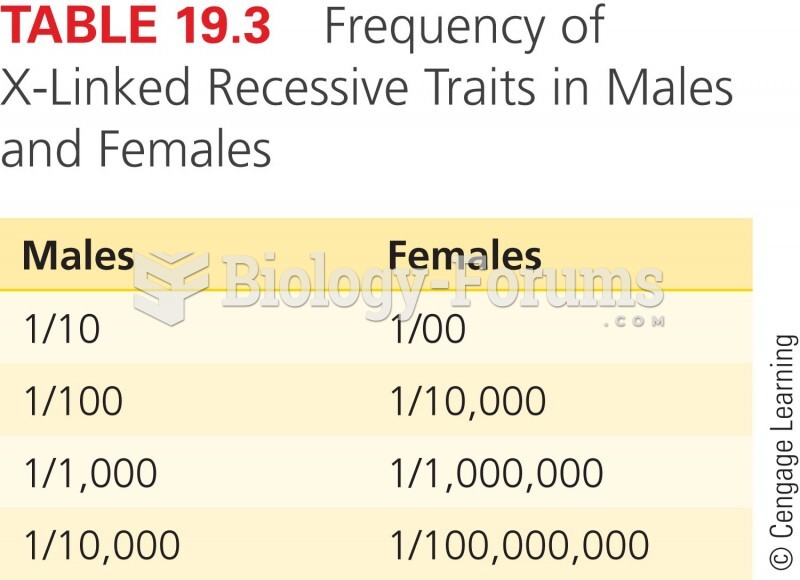 Frequency of X-Linked Recessive Traits in Males and Females