This topic contains a solution. Click here to go to the answer
|
|
|

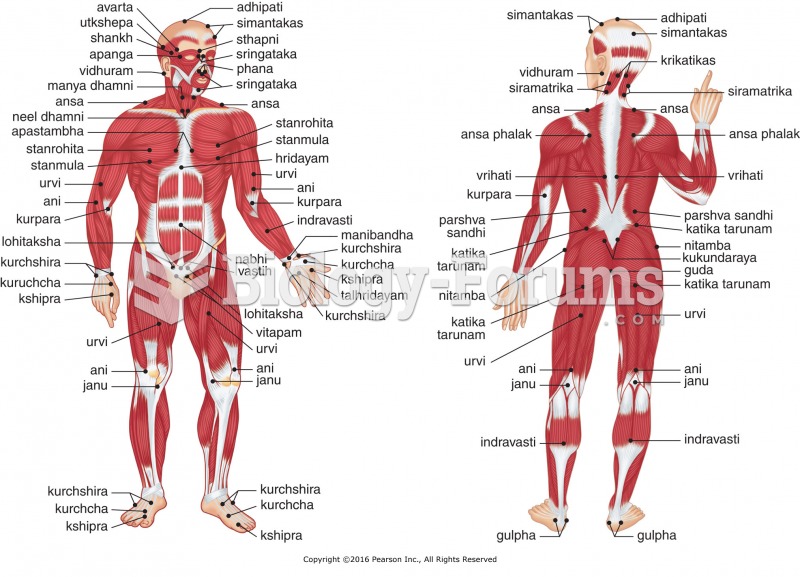 Major marma point locations.
 Set-Point Theory
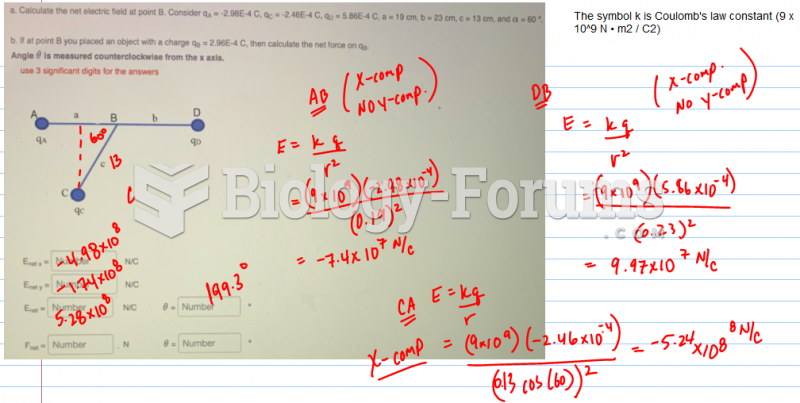 . Calculate the net electric field at point B
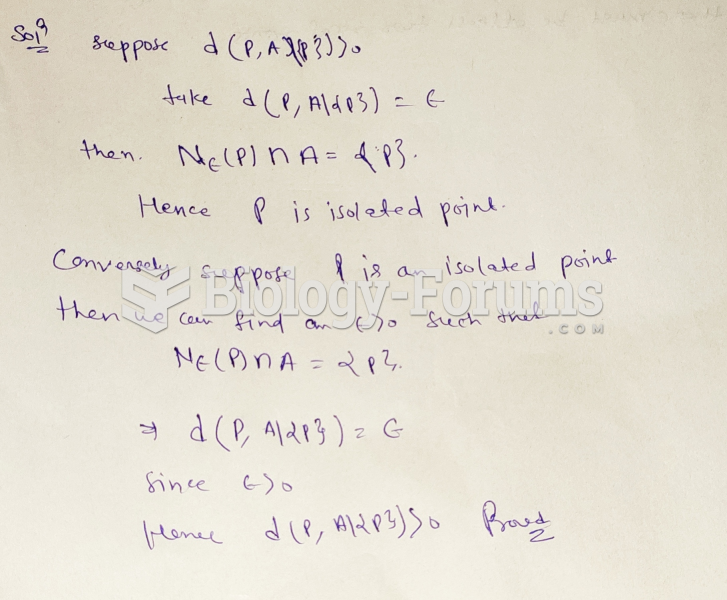 Let A ⊆ R and p ∈ A. Suppose A\{p}6= ∅. Prove that p is an isolated point of A if and ...
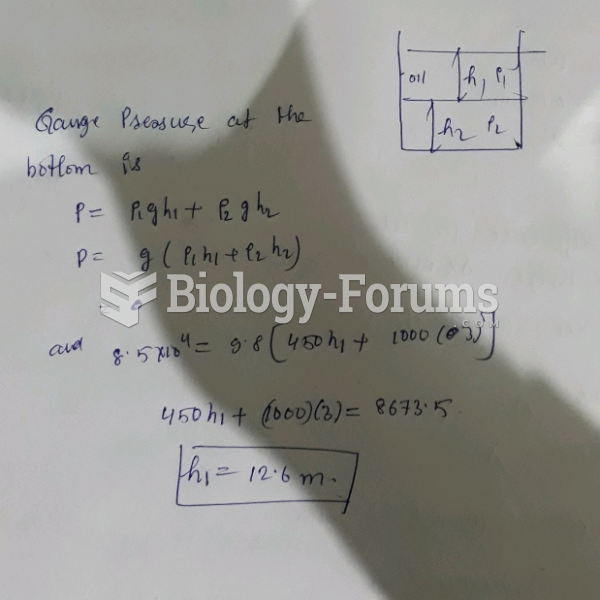 As shown in the figure, a large open tank contains a layer of oil ( density 450 kg/m3) floating ...
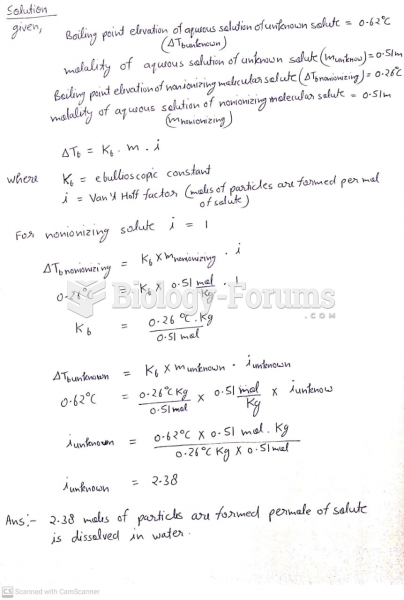 A 0.51 m aqueous solution of an unknown solute has a boiling point elevation of 0.62°C. The ...