This topic contains a solution. Click here to go to the answer
|
|
|

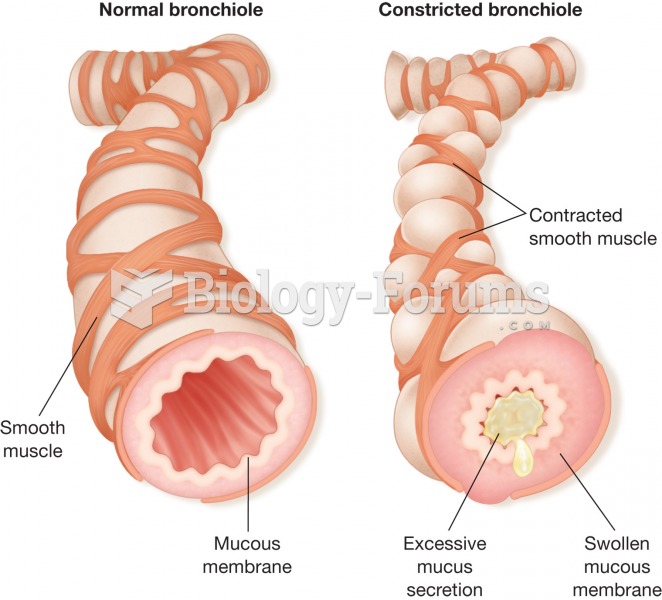 Asthma. (a) A normal bronchiole. (b) An asthmatic bronchiole. During an asthma “attack,” the bronchi
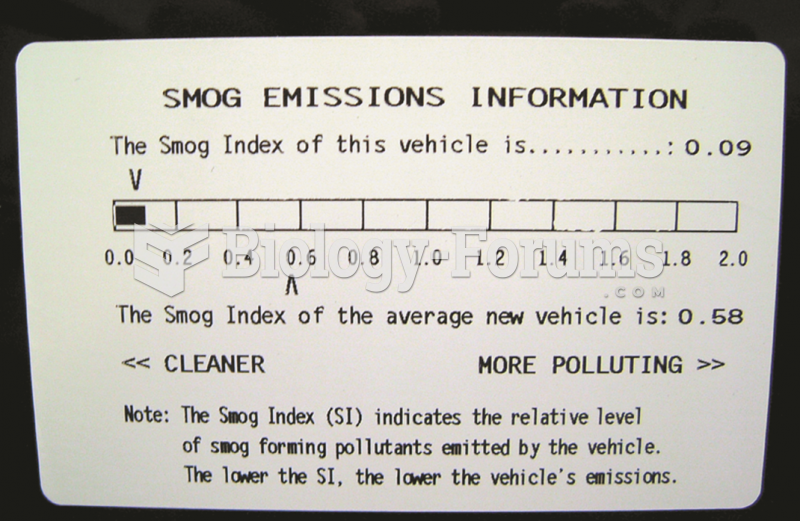 This label on a Toyota Camry hybrid shows the relative smog-producing emissions, but this does not ...
 Discrete random variables- Probability Distribution Function
 Relationship between birth weight and mortality in humans
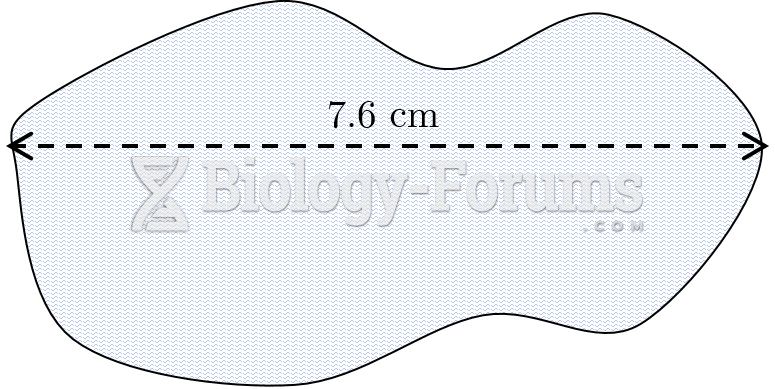 Offset Method Plot of Land with Length Line
 Gamete genotype frequencies calculated from genetic linkage data