This topic contains a solution. Click here to go to the answer
|
|
|

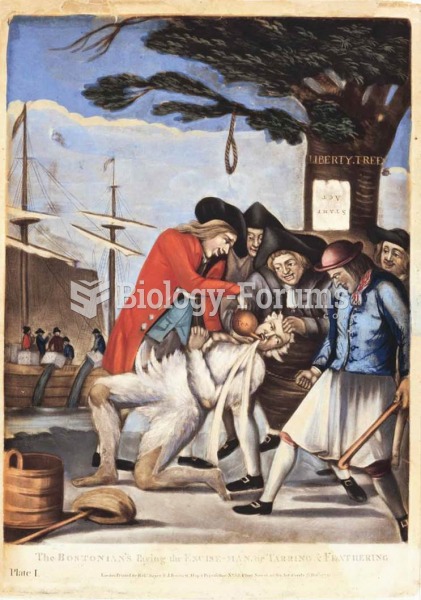 A noose hanging from a “Liberty Tree” reveals this artist’s bias: The “tar-and-feathering” of a Brit
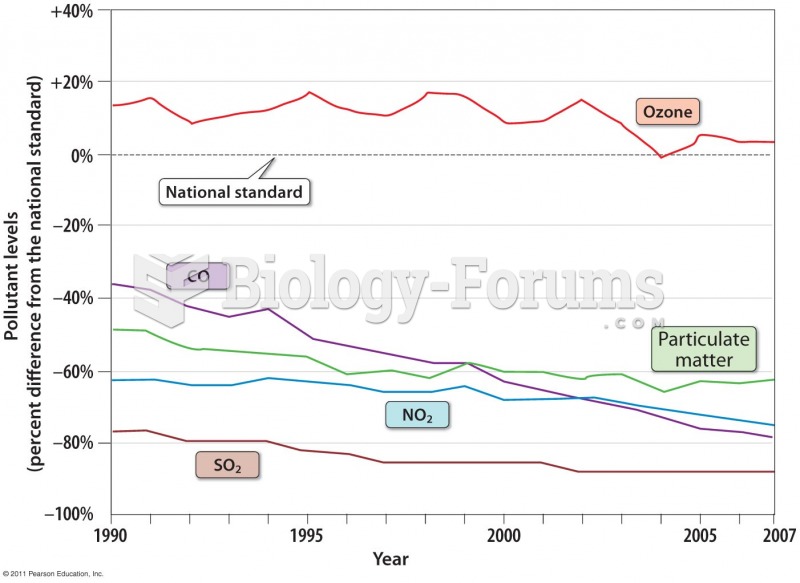 Emission Trends
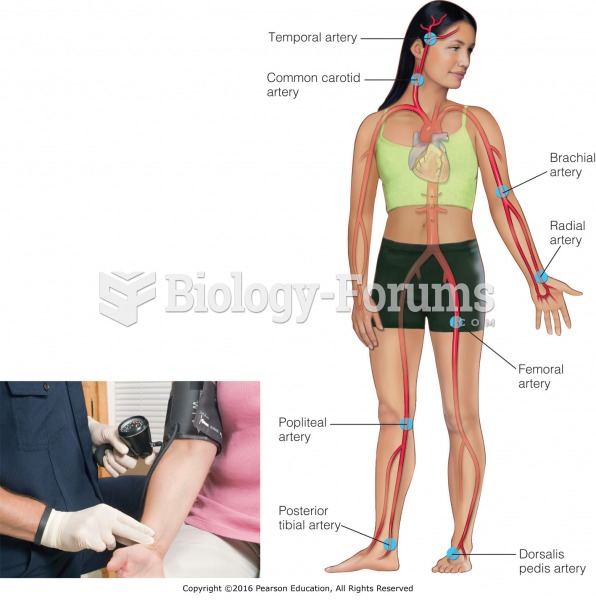 A health care professional taking a radial pulse and common pulse points.
 Trends in Air Quality
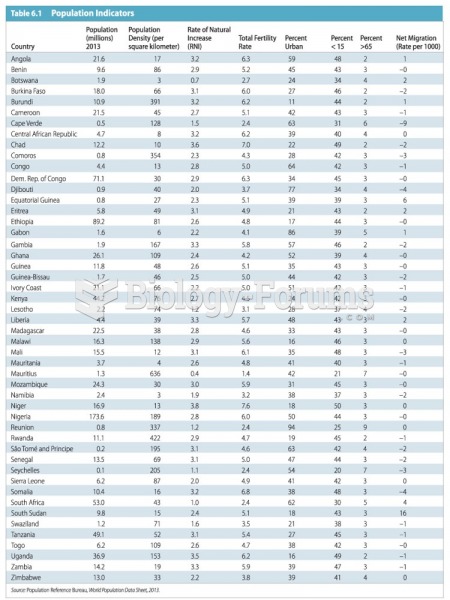 Demographic Trends and Debates
 Complete the following production chart and plot the points.