|
|
|

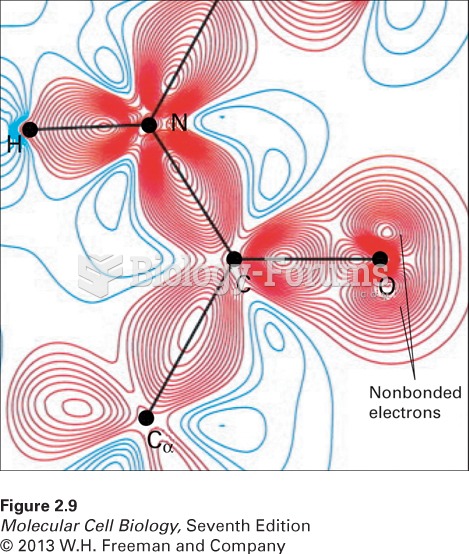 Distribution of bonding and outer nonbonding electrons in the peptide group
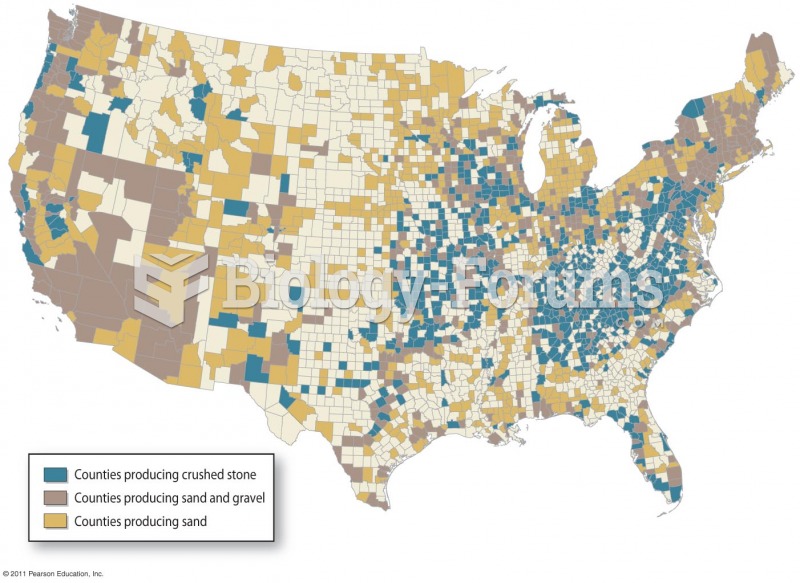 Distribution of Aggregate Mining
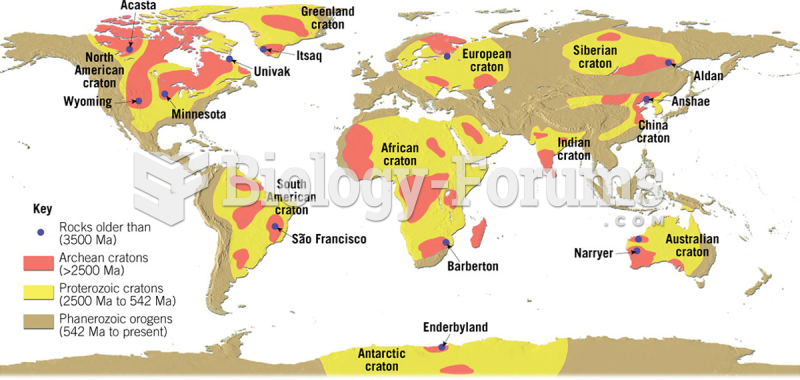 Distribution of Crust Remaining from Archean and Proterozoic
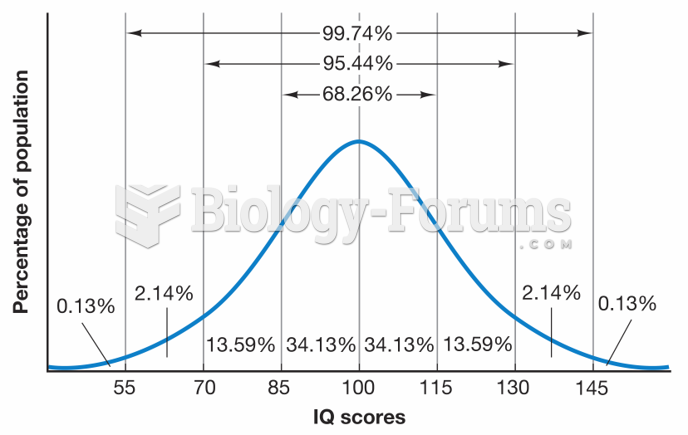 Expected Distribution of IQ Scores
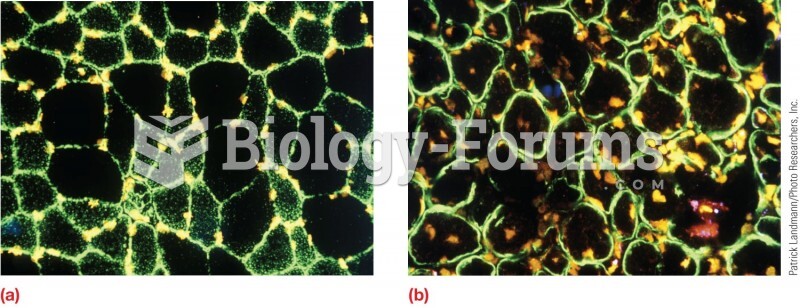 Distribution of dystrophin in muscle cells. (a) In normal muscle cells, all the dystrophin is locate
 Distribution Patterns and Population Size Estimates (Bio 30)