|
|
|

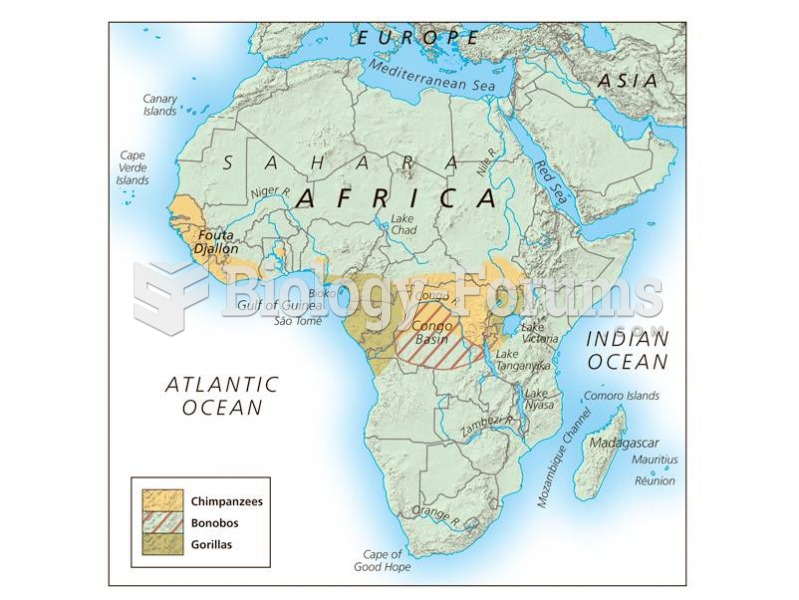 Distribution of the African great apes.
 Sample Exercise Program for Limited Older Adults (cont.)
 Mammogram showing microcalcifications.
 The Distribution of Dominant and Minority Groups
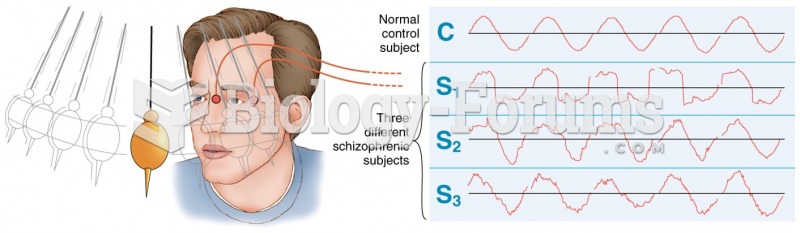 Visual tracking of a pendulum by a normal control subject (top) and three schizophrenics. (Adapted ...
 Sample prescriptions of antibiotics for prophylaxis against infective endocarditis.