|
|
|

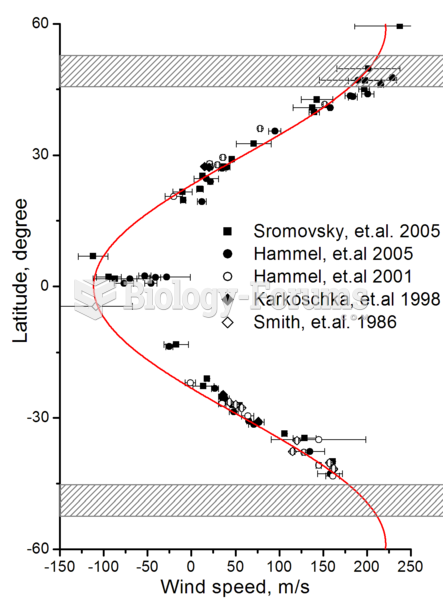 Zonal wind speeds on Uranus. Shaded areas show the southern collar and its future northern counterpa
 A physician uses a portable electronic tablet to enter patient data while in the examination room.
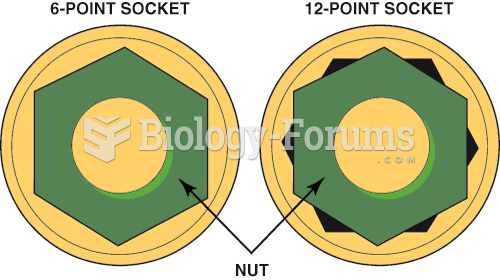 A 6-point socket fits the head of a bolt or nut on all sides. A 12-point socket can round off the ...
 The molality of a C12H23O11 solution is 0.6 m. what is the freezing point of the solution C?
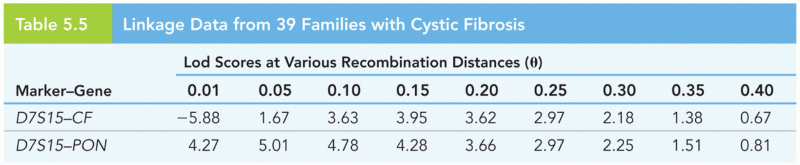 Linkage Data from 39 Families with Cystic Fibrosis
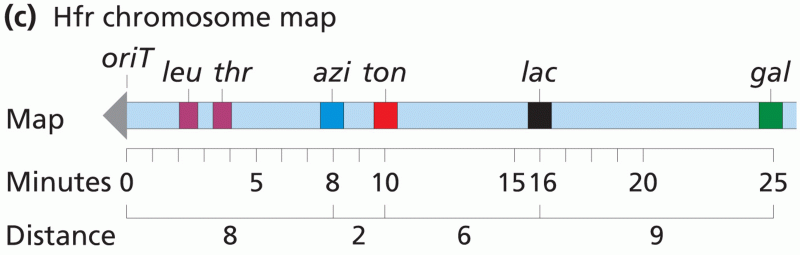 The Hfr chromosome time-of-entry map is assembled from the recombinant data