|
|
|

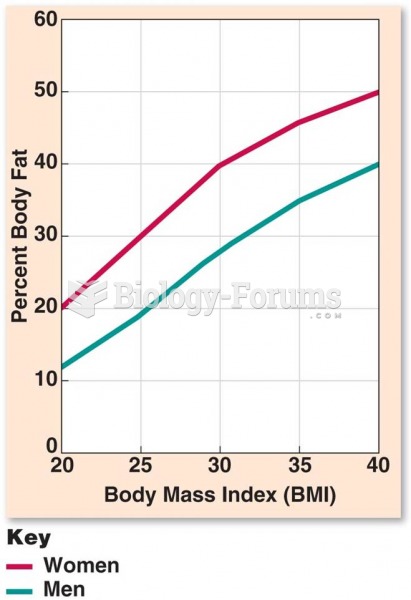 Relationship Between BMI and % BF
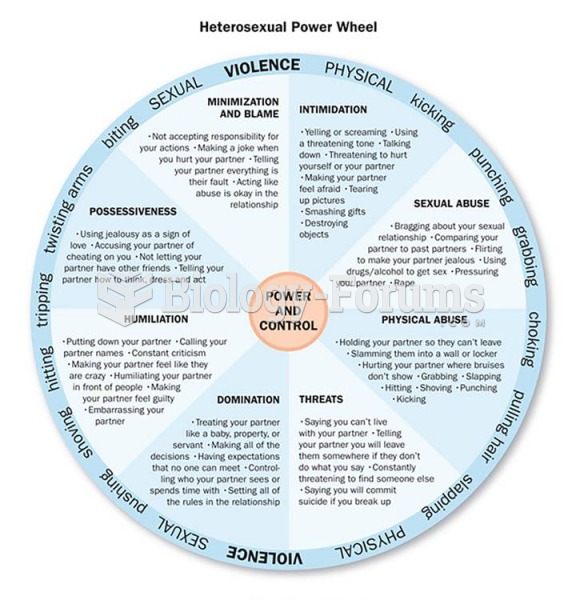 The Power and Control Wheels of Abusive Relationships When one person in a relationship repeatedly ...
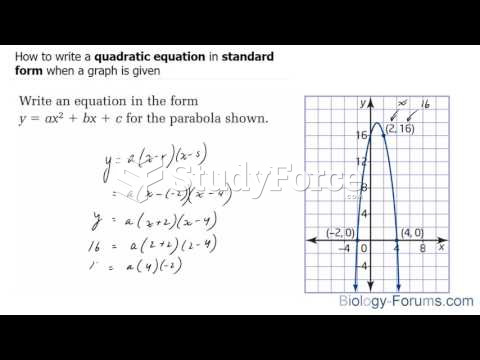 How to write a quadratic equation in standard form when a graph is given
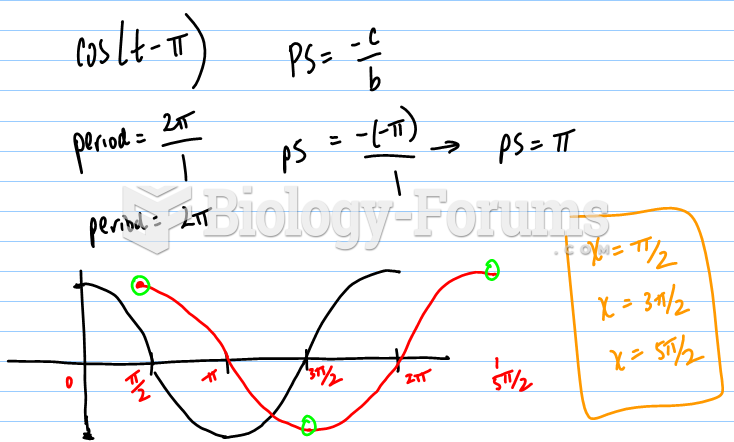
 Graph the function by hand & label key points on graph:
 IROC on a Graph Questions
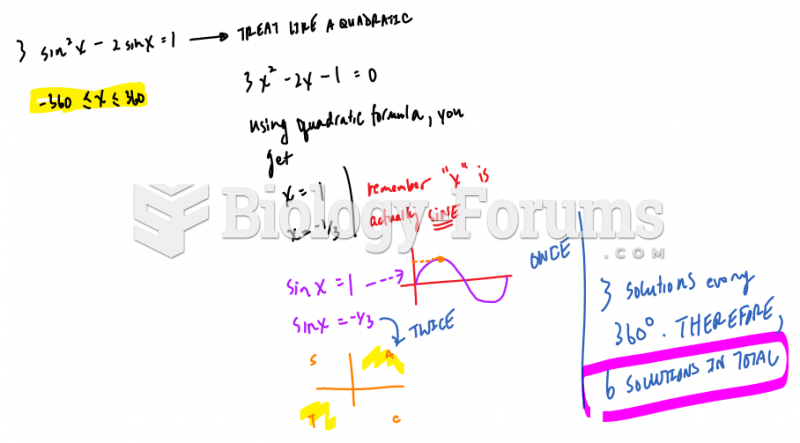 Solving graphically