This topic contains a solution. Click here to go to the answer
|
|
|

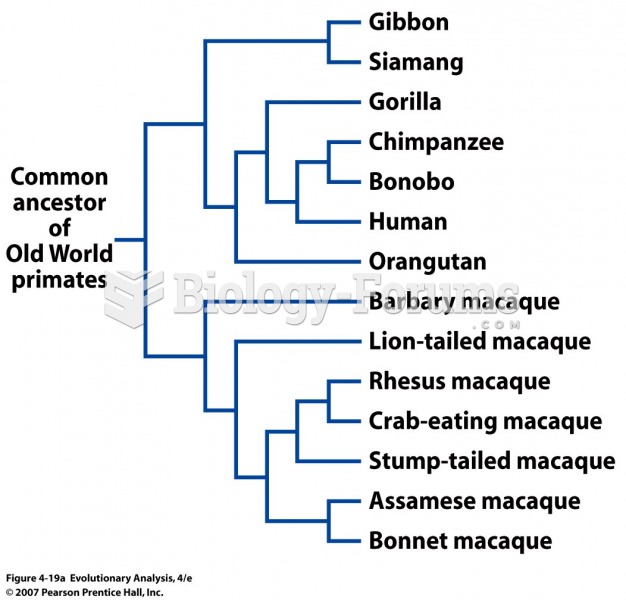 Phylogenies showing the relationships of some Old World primates
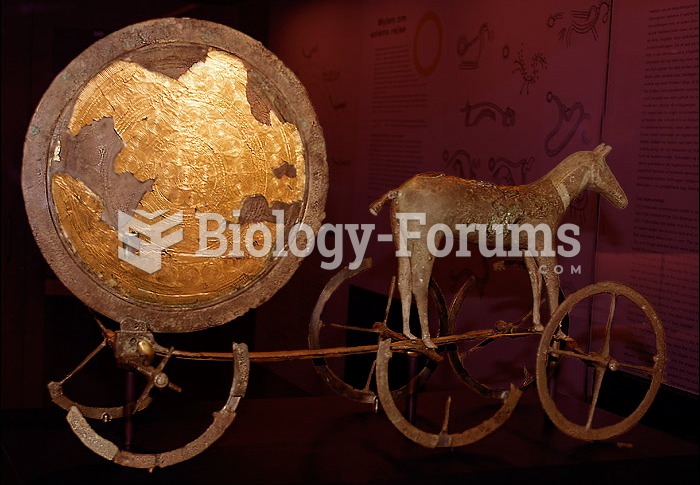 The Trundholm Sun chariot pulled by a horse is a sculpture believed to be illustrating an important
 Photograph illustrating the development of an embryo.
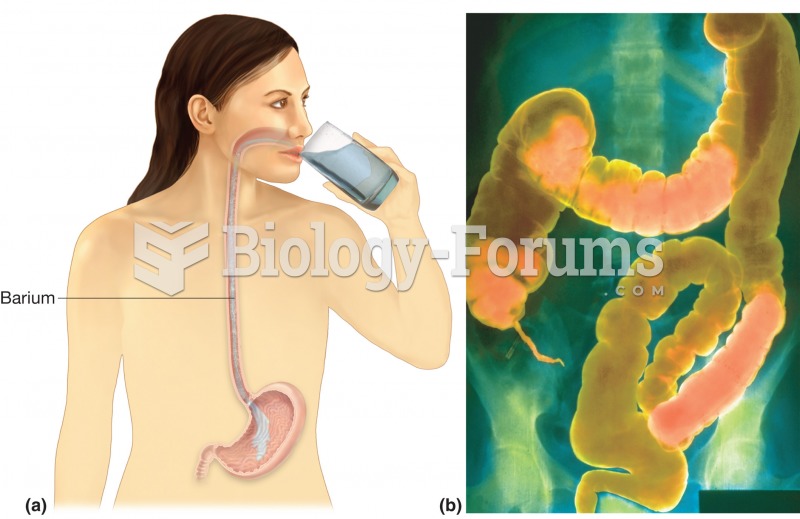 GI series. (a) Upper GI series begins with a barium swallow, barium shake, or barium meal. (b) Lower
 Having a time zone map located near the telephone will assist you when making long distance calls ou
 Sibling relationships can be intense, in terms of both having fun together and engaging in conflict.