This topic contains a solution. Click here to go to the answer
|
|
|

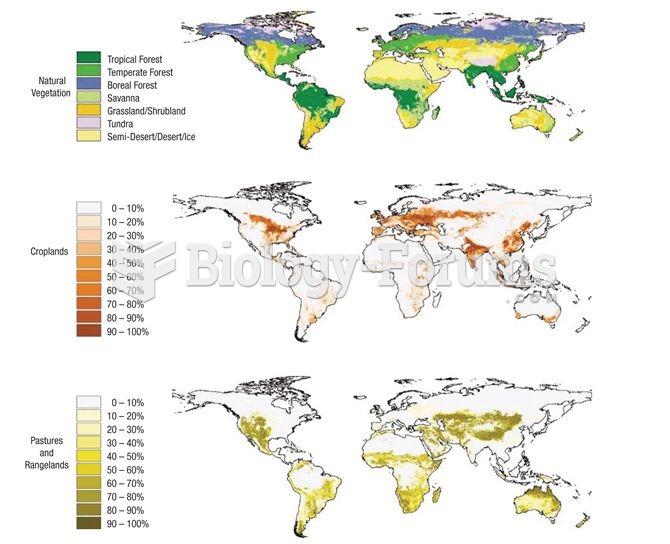 Extent of agricultural activity across the planet (data from Foley et al. 2005).
 Instruct the patient to use an applicator to apply a small amount of stool in the appropriate boxes ...
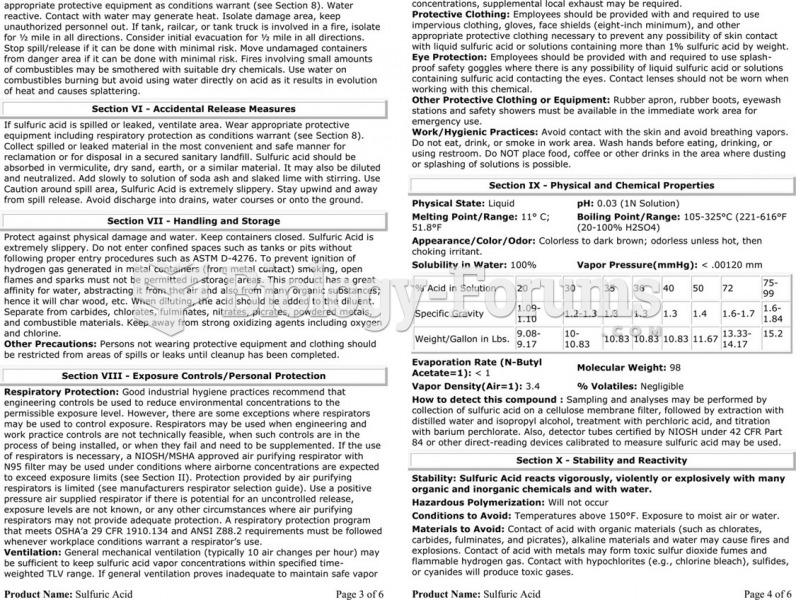 The material safety data sheet (MSDS) for sulfuric acid showing the detailed technical information ...
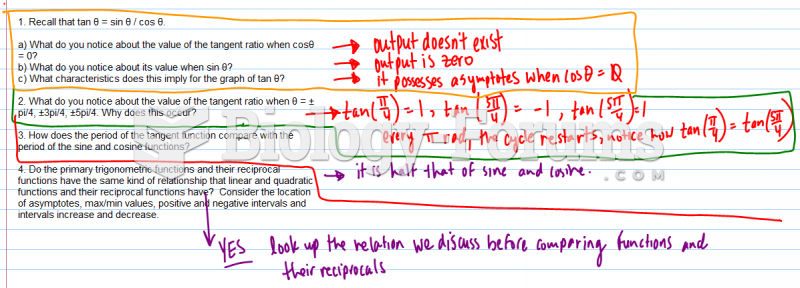 Graphs of Primary Trigonometric Ratios
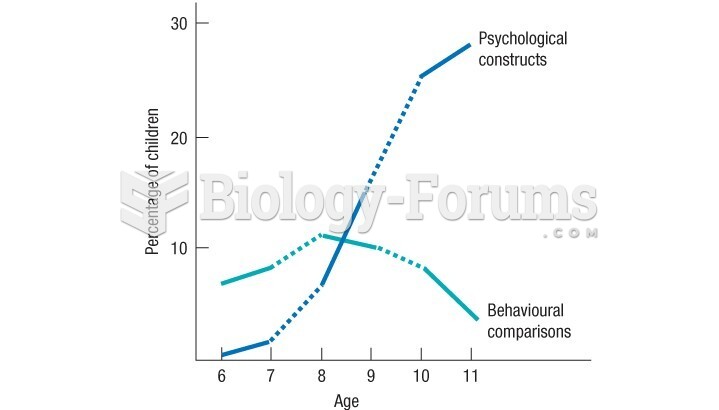 Barenboim's study show the change in children's descriptions of their peers
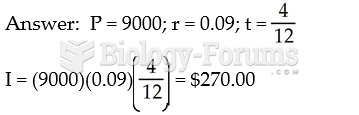 Calculate the amount of interest that will be charged on $9000.00 borrowed for four months at ...