This topic contains a solution. Click here to go to the answer
|
|
|

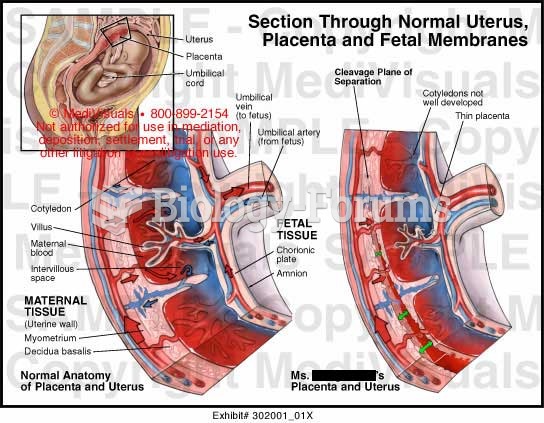 blood supply
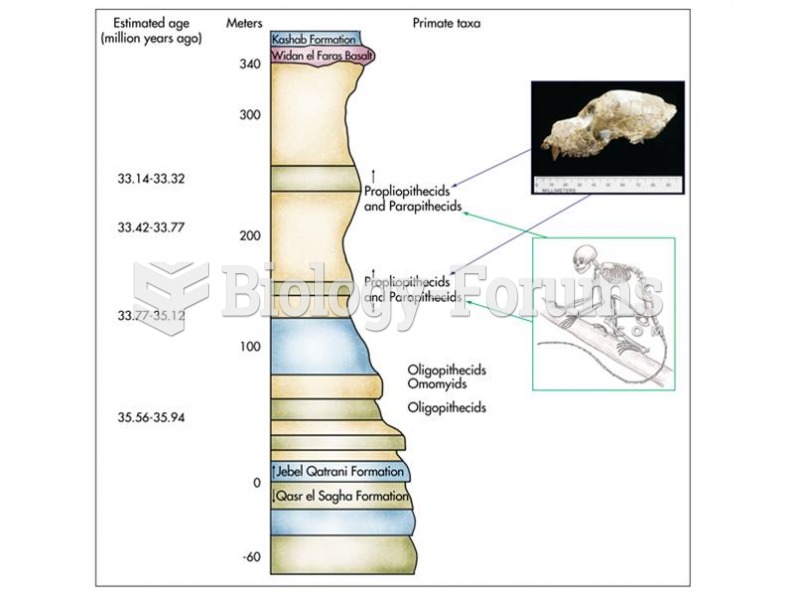 Stratigraphic section of the Fayum shows the relative age of early anthropoid fossils.
 C. Wright Mills (1916-1962) was a controversial figure in sociology because of his analysis of the ...
 The upper panel shows that scores of four diverse samples of boys on a moral reasoning test show a ...
 Connect a fused jumper wire to supply 12 volts to terminal 86 and a ground to terminal 85 of the ...
 Titration curve for the tetrapeptide Glu-Gly-Ala-Lys