This topic contains a solution. Click here to go to the answer
|
|
|

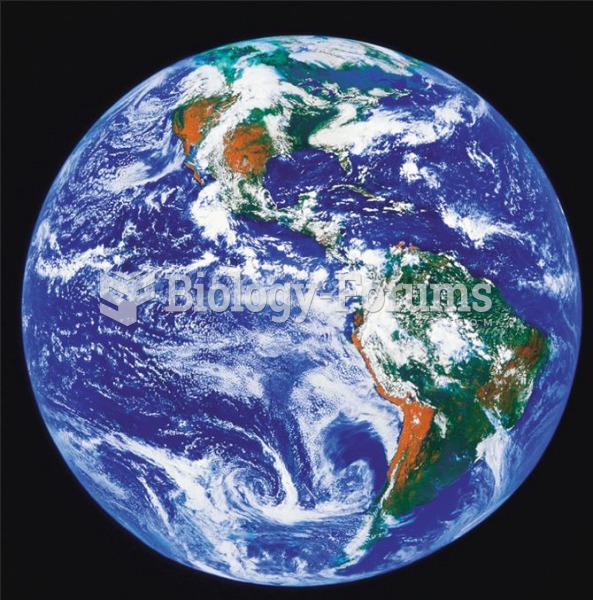 From space earth shows itself as a planet covered mostly by water.
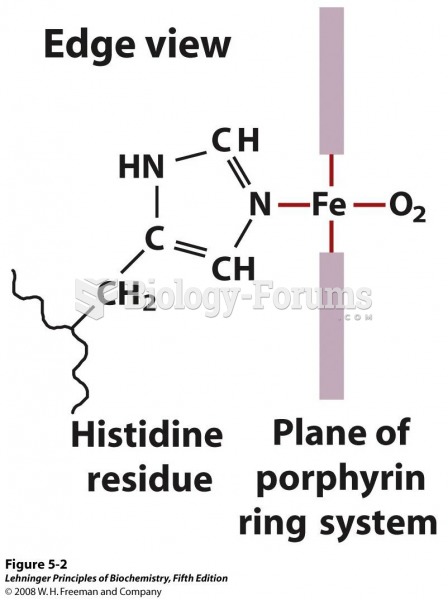 The heme group viewed from the side. This view shows the two coordination bonds to Fe2+
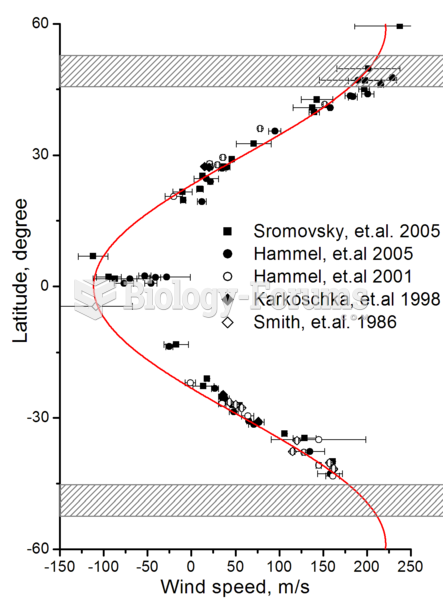 Zonal wind speeds on Uranus. Shaded areas show the southern collar and its future northern counterpa
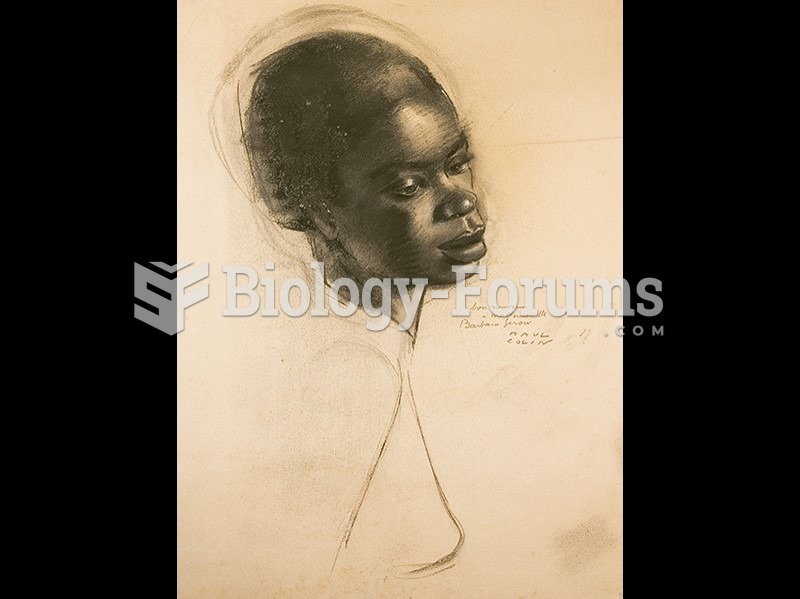 Paul Colin, Figure of a Woman.
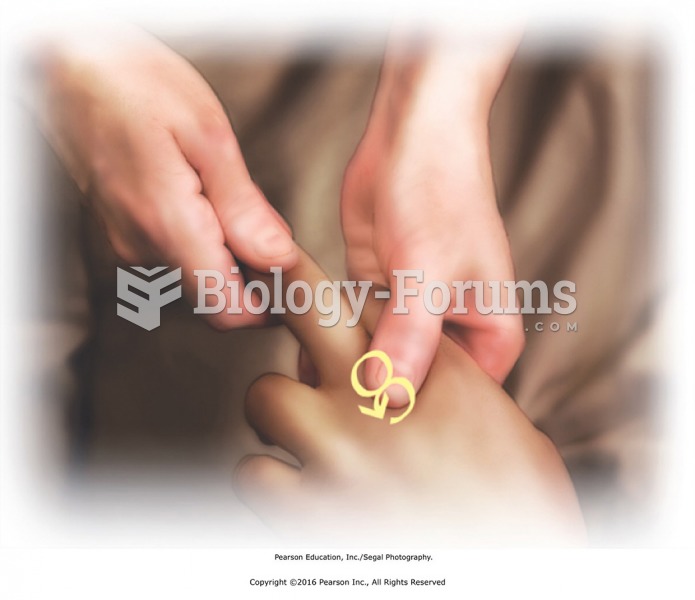 Mobilize the joints in the hand. Follow with figure-8s at the knuckles and scissoring the ...
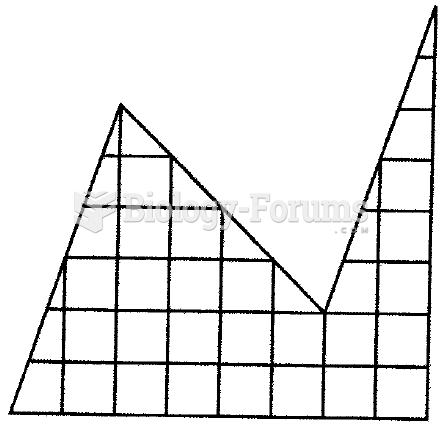 Cut the figure into two identical parts