This topic contains a solution. Click here to go to the answer
|
|
|

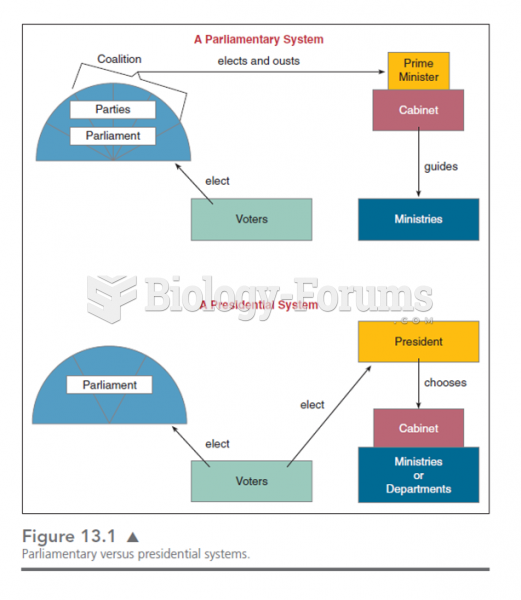 This chart shows the various lines of responsibility and how they differ in presidential and parliam
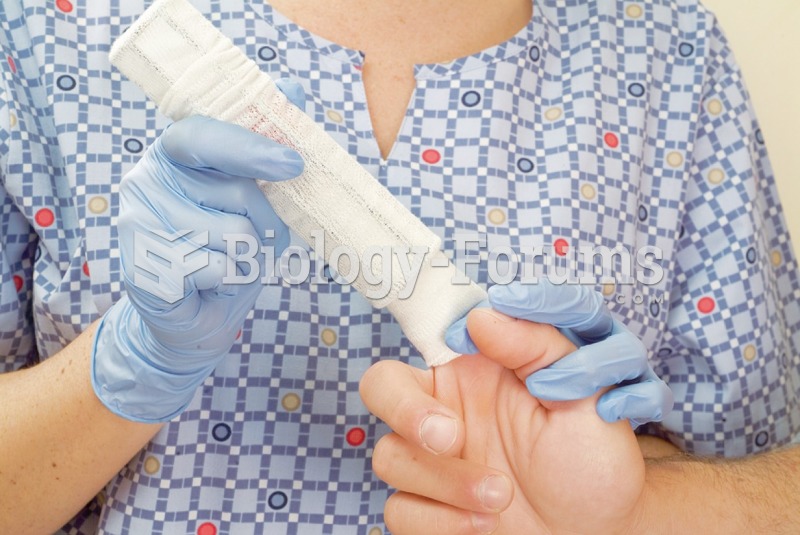 Demonstrate the Application of Triangular, Figure-Eight, and Tubular Bandages
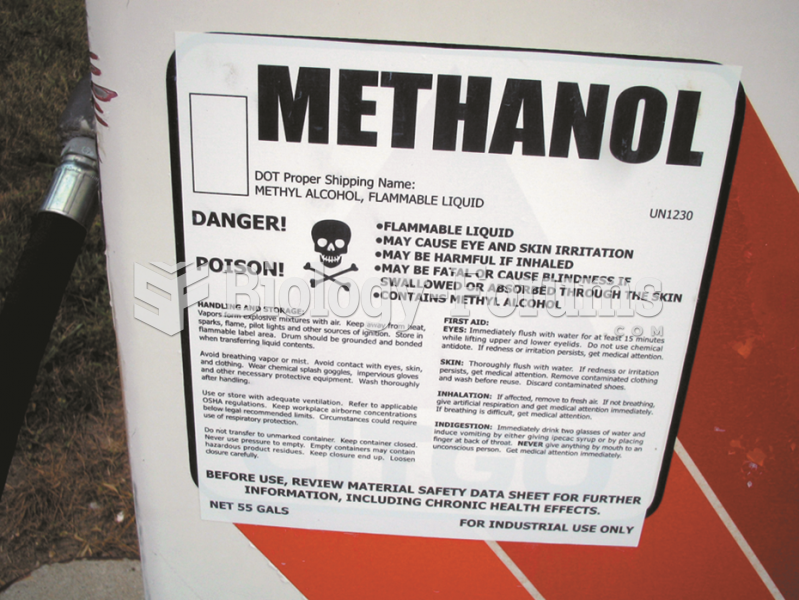 Sign on methanol pump shows that methyl alcohol is a poison and can cause skin irritation and other ...
 EYEMA-O-BYERI (Reliquary Figure)
 A melting profile shows the increase in UV absorption versus temperature
 Bayesian Analysis of the Genotype of II-2 in Figure A.4