This topic contains a solution. Click here to go to the answer
|
|
|

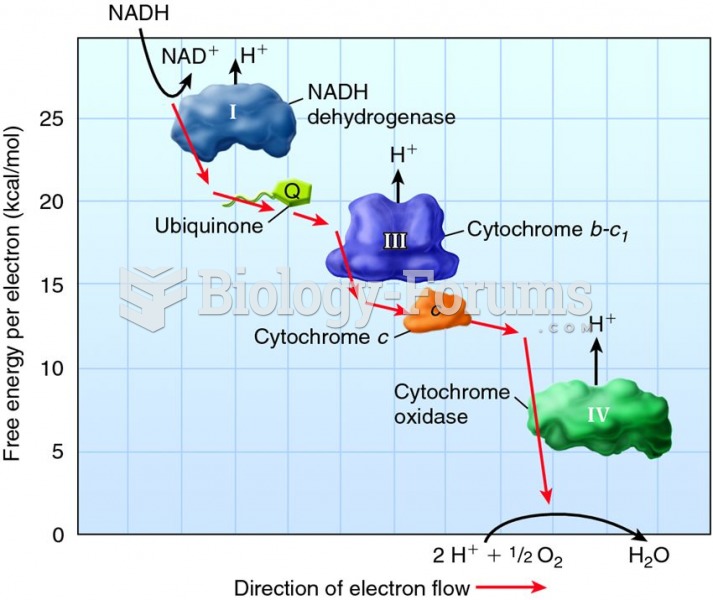 The relationship between free energy and electron movement along the electron transport chain
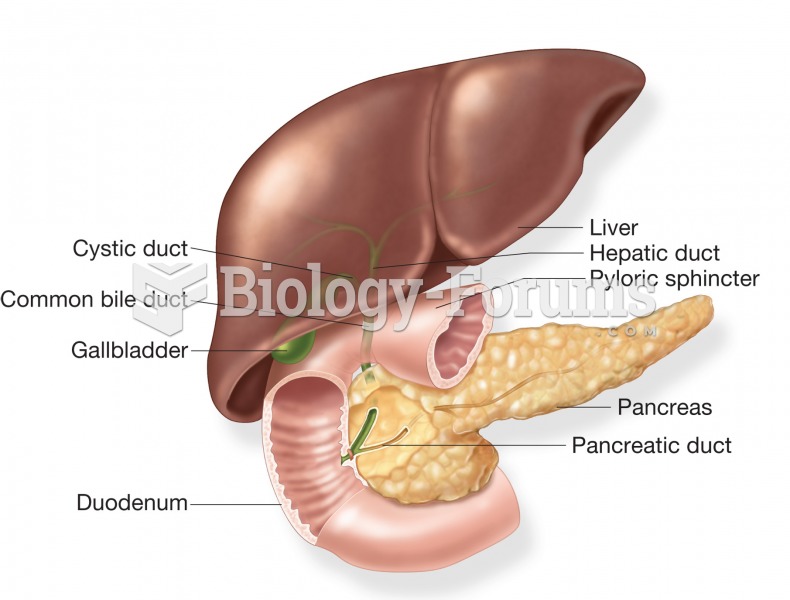 The accessory organs of the digestive system: the liver, gallbladder, and pancreas. Image shows the
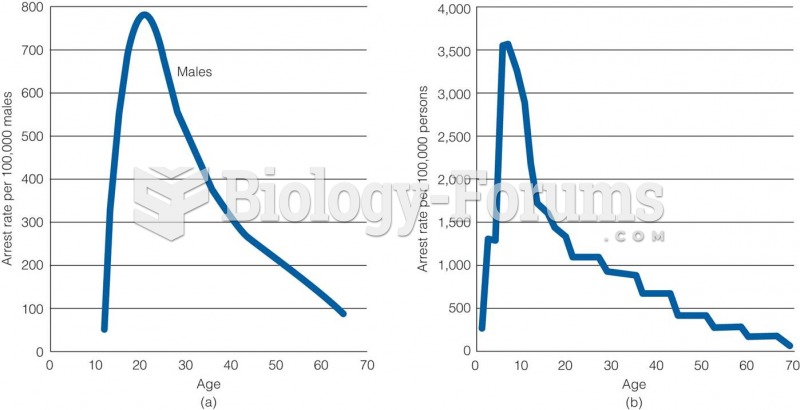 Age-Crime Relationship in (a) 1842 and (b) 1992
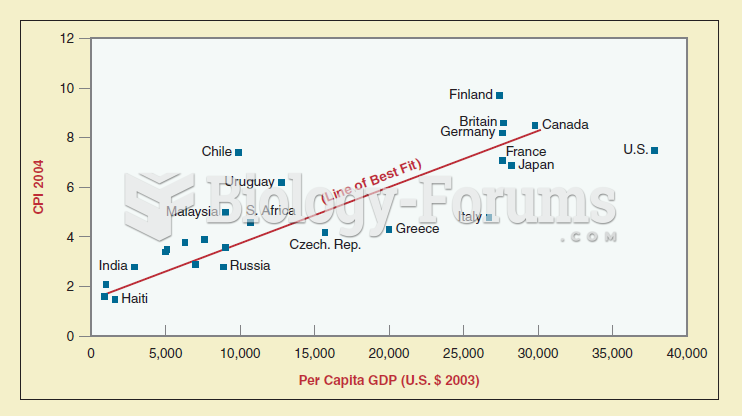 Scattergrams are a mechanism used by political scientists to show patterns and relationships among v
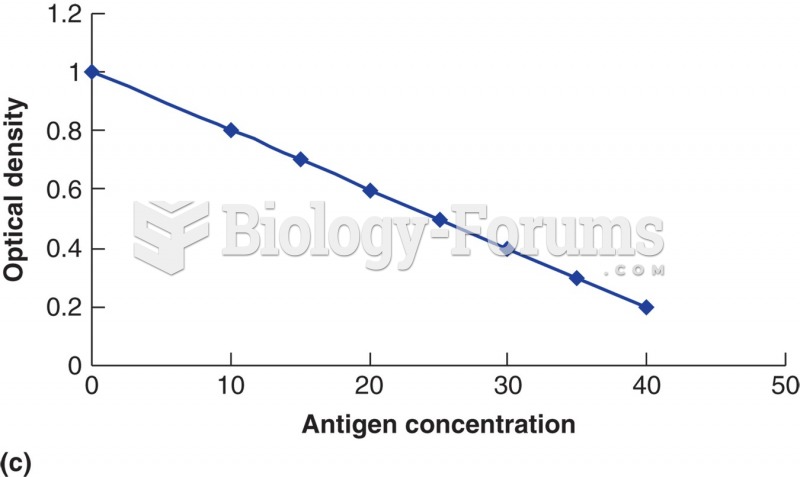 The relationship of substrate con- version (as measured by optical density) to the amount of patient ...
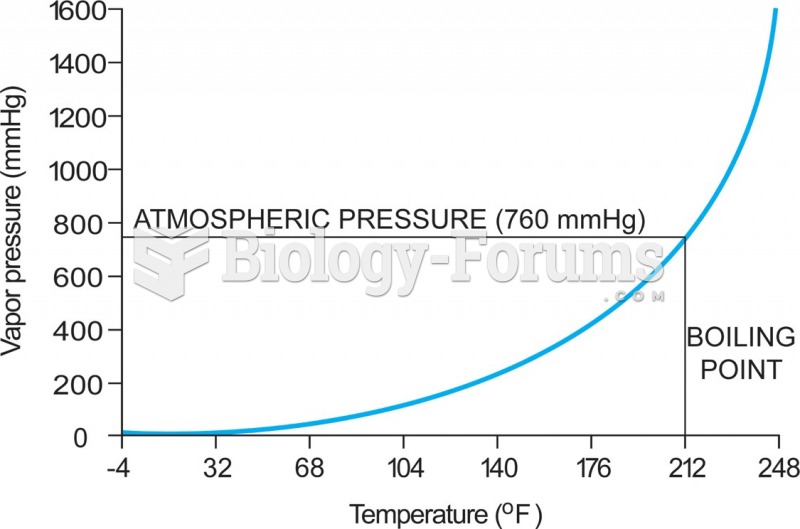 5-4 The relationship between vapor pressure and temperature—in this case for water. As the ...